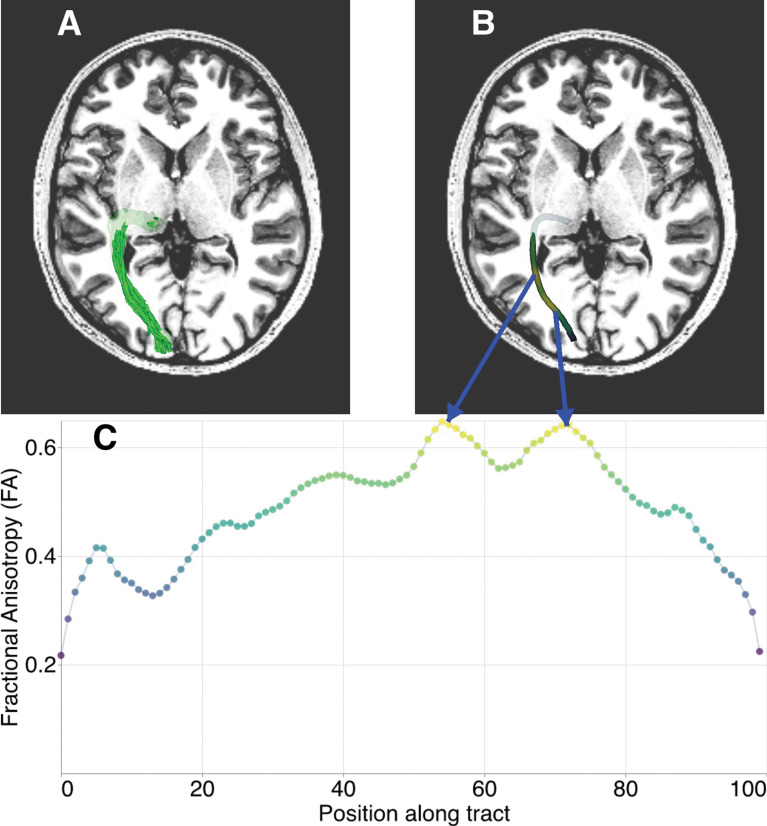
Fig. 3.
Tractometry of tissue properties along the length of a white matter tract. A: Representation of a white matter tract (here the optic radiation) as streamlines overlaid on an axial section of a T1-weighted image in a randomly selected subject from the Healthy Brain Network252,253 dataset. B: Individual streamlines are used to sample the volume of tissue properties mapped throughout the brain. The core of the bundle of streamlines, represented as a thick tube, is colored based on values aggregated across the streamlines and weighted based on how closely they resemble the central tendency of the collection of streamlines. C: The tract profile is sampled at 100 points along the core of the tract and represented as a one-dimensional vector of values that are used for subsequent analysis and interpretation. The horizontal axis represents position along the tract (left, anterior; right, posterior), whereas the vertical axis represents FA. FA, fractional anisotropy.

