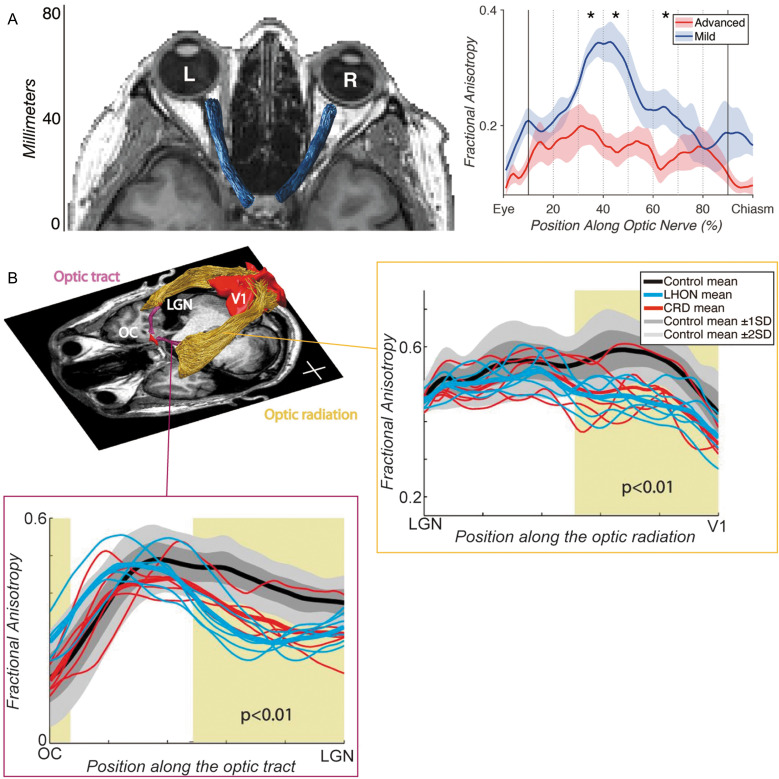
Fig. 4.
Tractometry on early visual white matter tracts. A: Tractometry study by Miller et al. (2019)108 focusing on the ON in patients with unilateral advanced-stage glaucoma. Left panel: The ON (blue) identified by tractography overlaid on the axial image of structural MRI data. Right panel: Tract profiles on dMRI data acquired from patients with unilateral advanced-stage glaucoma patients, comparing fractional anisotropy (vertical axis) along the ON between eyes with advanced (red) and mild (blue) glaucoma. The horizontal axis describes normalized positions along the ON. Images are adapted from Miller et al. (2019)108 under the Attribution 4.0 International Creative Commons license (CC BY 4.0). B: Tractometry study by Ogawa et al. (2014)118 focusing on the OT and OR in patients with LHON and CRD. Left top panel: Tractography on the OT (purple) and OR (yellow) in a representative participant overlaid on an axial slice of a T1-weighted image. The positions of the OC and primary visual cortex (V1) are also depicted. Left bottom panel: Tract profiles of the OT, based on dMRI data acquired from patients with LHON (cyan) and CRD (red), and healthy controls. Dark and light gray shadows depict the range of ±1 SD and ±2 SD from the control mean. The horizontal axis describes normalized positions along the OT. Right top panel: Tract profile of the OR. Conventions are identical to those used in the OT tract profile. Reprinted by permission from reference 118. CRD, cone-rod dystrophy; dMRI, diffusion-weighted MRI; LHON, Leber’s hereditary optic neuropathy; OC, optic chiasm; ON, optic nerve; OR, optic radiation; OT, optic tract; SD, standard diviation.

