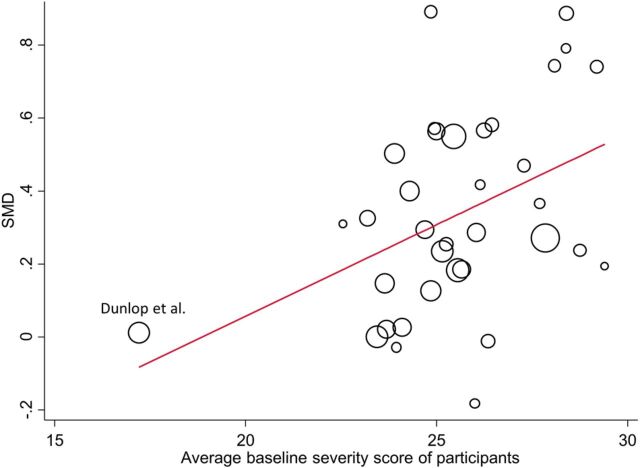
Figure 1.
Graphical illustration of the relationship between the average baseline severity score of study participants (ie, the average score from all participants on a continuous symptom scale at the beginning of each study) and the relative effect of antidepressants for the Kirsch data.10 The size of the circles is proportional to the precision (inverse of the variance) of the studies. The line represents the meta-regression line (SMD, standardised mean difference).

