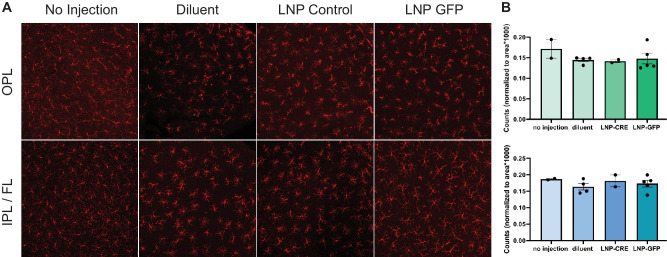
Figure 5.
Distribution of microglia in LNP EGFP injected and control retinas. (A) Microglial cells were visualized using anti-Iba1 immunostaining of flatmounted, uninjected mouse retinas and retinas injected with LNP GFP 6T, LNP CRE-recombinase (Control), or 1xPBS (Diluent) with Fast Green dye. Images represent maximum intensity projections of volumes acquired in the outer plexiform layer (OPL) or the inner plexiform layer and fiber layer (IPL/FL). (B) Quantification of Iba1+ microglial cells in the OPL or IPL/FL normalized to area (n > 2 retinas per condition). Each point on the bar graph represents a single retina where the number of microglia in two independent mid-peripheral regions were quantified and normalized by area. Error bars represent standard deviation.

