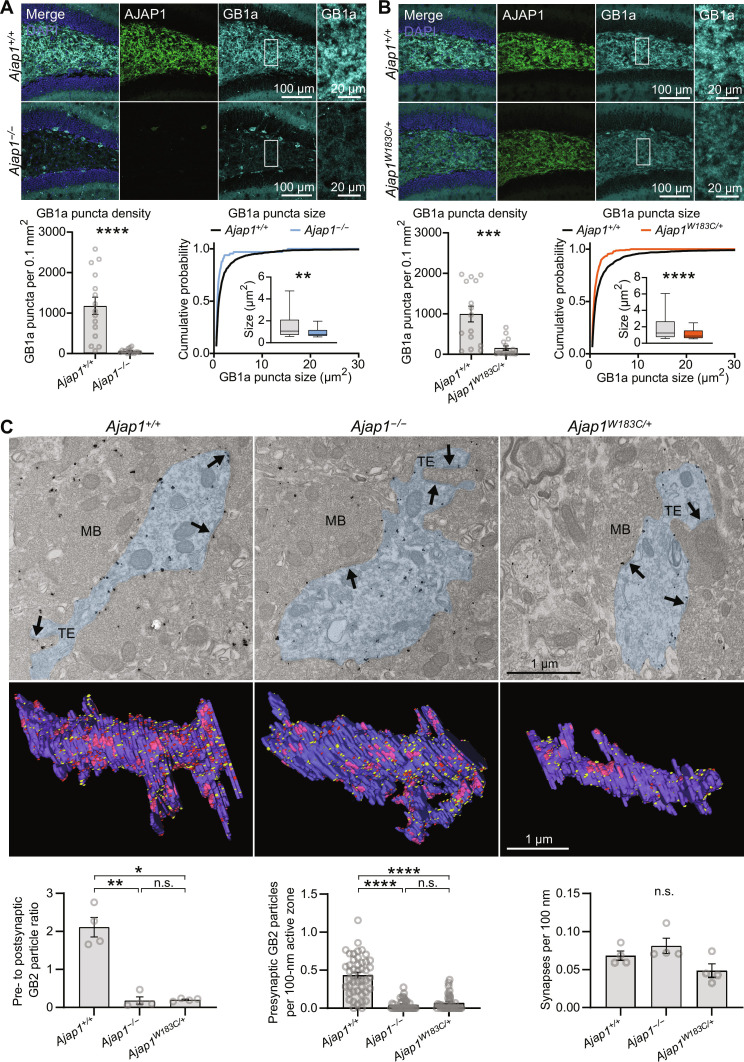
Fig. 6. Reduction in presynaptic GBRs in Ajap1−/− and Ajap1W183C/+ mice.
(A) Immunolabeling in the hilus of Ajap1−/− and Ajap1+/+ mice and quantification of GB1a puncta density and size in the neuropil. **P < 0.01, ****P < 0.0001, unpaired t test (density), Kolmogorov-Smirnov test (size), n = 15 sections per genotype (density), n = 1267 puncta (Ajap1+/+), n = 66 puncta (Ajap1−/−), five mice per genotype. Box plots 25th to 75th percentiles, whiskers 10th to 90th percentiles, and line indicates median. (B) Immunolabeling in Ajap1W183C/+ and Ajap1+/+ mice and quantification of GB1 puncta density and size. ***P < 0.001, ****P < 0.0001, Mann-Whitney test (density), Kolmogorov-Smirnov test (size), n = 15 sections per genotype (density), n = 1818 puncta (Ajap+/+), n = 291 puncta (Ajap1W183C/+), five mice per genotype. Box plots as in (A). (C) Electron microscopic quantification of GBRs at putative granule cell/HMC synapses in the hilus apex using pre-embedding immunogold labeling. Top: GB2 labeling in pre- and postsynaptic elements at asymmetrical synapses (arrows). Blue area indicates HMC dendrites. MB, mossy fiber bouton; TE, thorny excrescences. Middle: Serial section reconstructions of HMC dendrites showing pre- (red) and postsynaptic (yellow) GB2 particles (active zones in pink). Bottom: Ajap1−/− and Ajap1W183C/+ mice contain fewer immunogold particles at presynaptic elements, resulting in a significantly decreased pre- to postsynaptic particle ratio. GB2 particle density in active zones is lower in Ajap1−/− and Ajap1W183C/+ versus Ajap1+/+ mice. Synapse density (active zones per length of postsynaptic membrane) is similar among genotypes. n.s., P > 0.05, *P < 0.05, **P < 0.01, ****P < 0.0001, Welch’s ANOVA and Dunnett’s T3 multiple comparisons test (GB2 particle ratio); Kruskal-Wallis test and Dunn’s multiple comparisons test (GB2 particle density active zones); Kruskal-Wallis test (synapse density); n = 4 dendritic segments from two mice per genotype (GB2 particle ratio and synapse density), n = 35 to 45 active zones from two mice per genotype (GB2 particle density in active zones).

