
FIGURE 2.
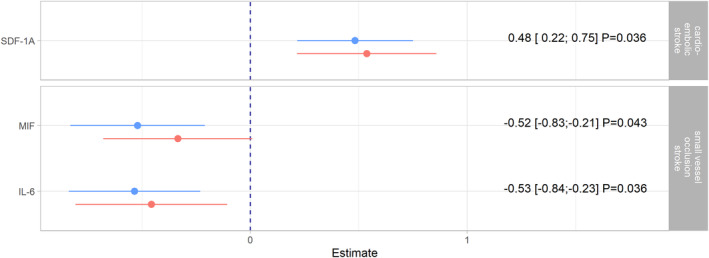
Notable associations from the main analyses (Figure 1) presented in graphical and tabular form as point estimates, 95% confidence intervals and false‐discovery rate (FDR)‐adjusted p‐values. These estimates (colored blue) are compared with estimates from subgroup analyses (colored red), in which patients undergoing reperfusion therapies were excluded. In the linear regression models, it was controlled for age (years), body mass index (kg/m2), the time between admission and blood collection (days), the National Institutes of Health Stroke Scale (NIHSS), sex, smoking status (never, ex, current), hypertension (yes, no), incident stroke (yes, no) and – only in the main analyses – for any treatment (systemic thrombolysis or thrombectomy, no).