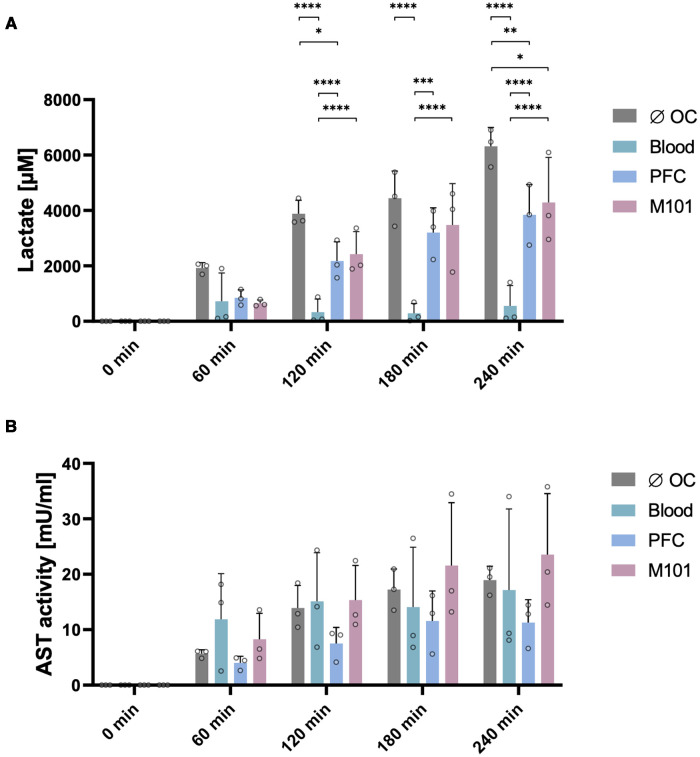
Figure 2.
Quality assessment of the kidney during normothermic EVKP using OCs. Lactate levels (A) and aspartate aminotransferase (AST) activity (B) were quantified in perfusates of control kidneys and kidneys exposed to OCs at different time points (0, 60, 120, 180, and 240 min). Graphs represent means and standard deviations (n = 3). Lactate levels differed significantly between the individual groups (*p < 0.05; **p < 0.01; ***p < 0.001; ****p < 0.0001; two-way ANOVA).

