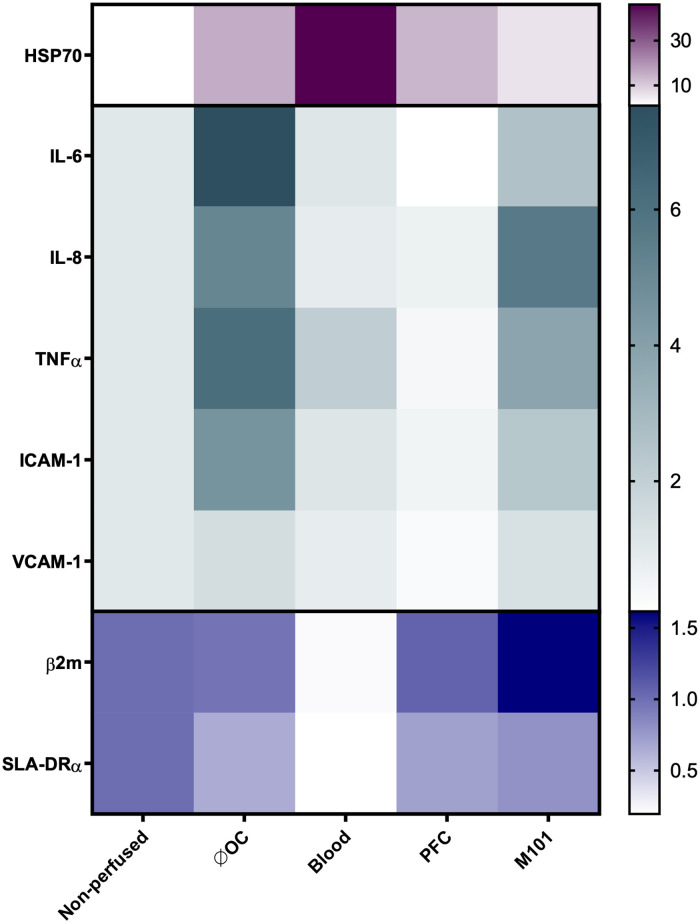
Figure 5.
Heatmap representing the gene expression profile of ex-vivo perfused kidneys using OCs. Relative quantification (RQ) of heat shock protein 70 (HSP70), IL-6, IL-8, TNFα, intercellular adhesion molecule 1 (ICAM-1), vascular cell adhesion molecule 1 (VCAM-1), β2-microglobulin (β2 m), and swine leukocyte antigen-DRα (SLA-DRα) gene expression in renal tissues measured by qPCR. The data were normalized to the endogenous housekeeper gene GAPDH. Color intensity represents the up- and downregulation of mRNA expression values relative to the control tissue of non-perfused kidneys. Compared to the kidneys perfused without OCs, IL-6 and ICAM-1 gene expression levels significantly decreased after addition of OCs (*p < 0.05; **p < 0.01; ***p < 0.001; ****p < 0.0001; one-way ANOVA).

