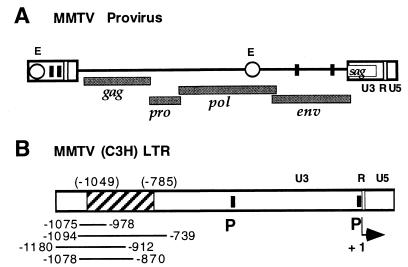
FIG. 1.
Schematic representation of an MMTV provirus and regulatory elements for MMTV gene expression. (A) MMTV provirus. The positions of viral genes (gag, pro, pol, env, and sag), promoters (filled squares), LTR and pol gene enhancers (E) (open circles), functional regions within the LTRs (U3, R, and U5), and the sag gene are indicated. (B) MMTV LTR. Shown is the LTR of MMTV strain C3H, with the positions of the mammary gland cell enhancer, as described by four different labs (7, 12, 14, 24), represented as solid lines below the LTR. The location of the newly characterized hematopoietic progenitor cell enhancer from positions −1025 to −761 of the Mtv-1 LTR, corresponding to the region from positions −1049 to −785 of the C3H LTR, is shown as a hatched box. The positions of promoters (P) within the LTR, functional regions (U3, R, and U5), and the transcription start site (+1, arrow) are indicated.

