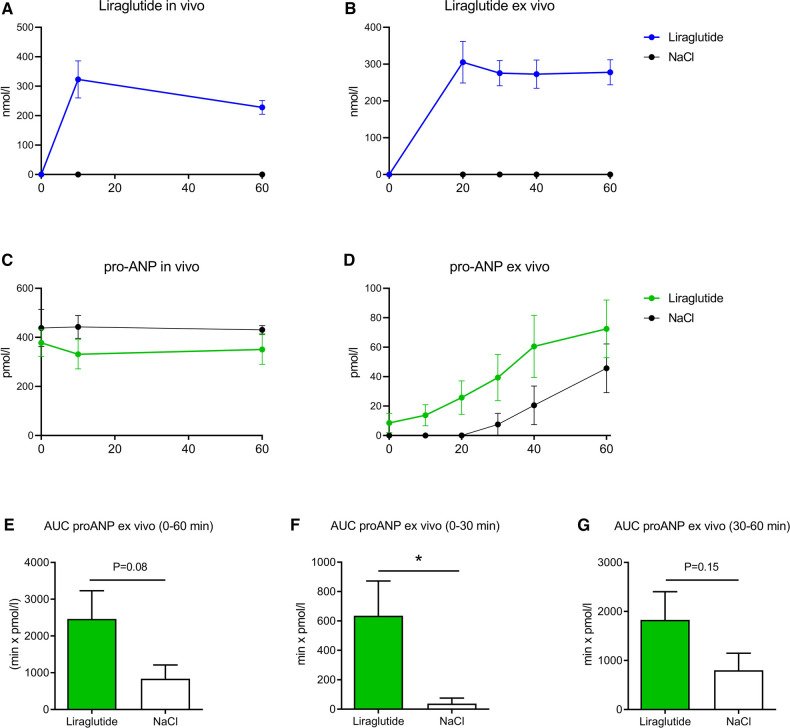
Figure 3.
Plasma concentrations of liraglutide (A) and proANP (C) over time after a bolus of 40 µg/kg liraglutide or saline in pigs. Concentration of liraglutide (B) and proANP (D) over time in perfusion buffer added 1.125 mg liraglutide or saline. AUC of proANP in perfusion buffer for 0–60 min (E), first 30 min (F) and last 30 min (G). Data is shown as mean ± SEM, n (saline) = 6, n (liraglutide) = 9. *p < 0.05. Statistics were performed using a two-way ANOVA.

