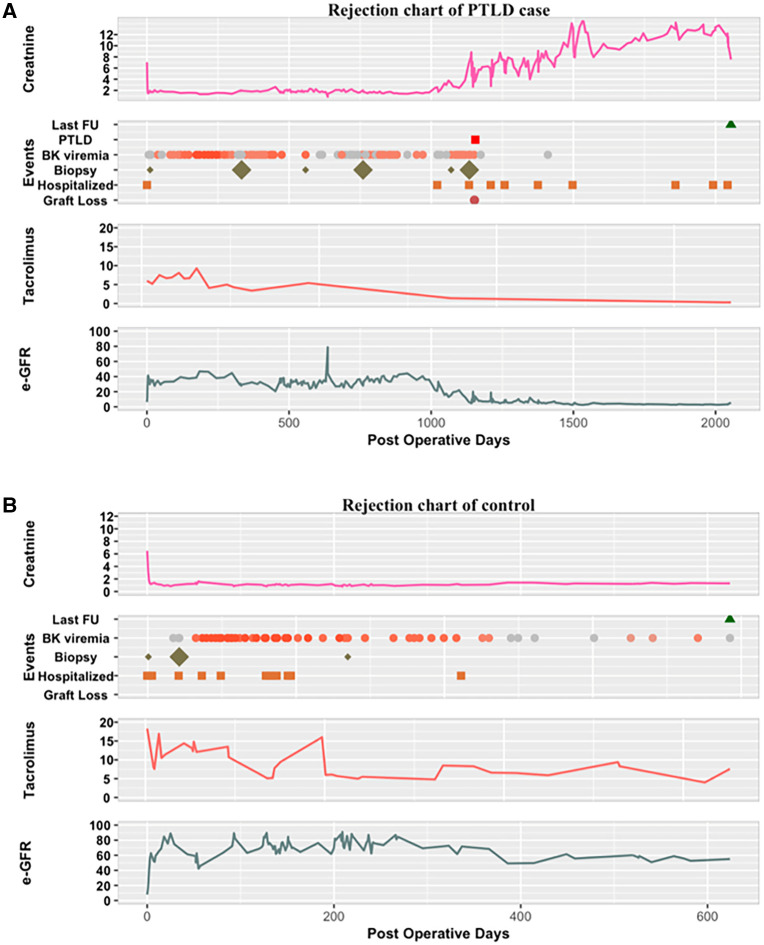
Figure 1.
Representative clinical event maps of (A) PTLD case and (B) control patients from date of transplant until date of last follow-up. For BK viremia plots, gray circles signify undetectable levels, with darkening orange gradient signifying higher viral levels. For biopsy plots, small diamond signifies grade 1 rejection, large diamond signifies higher grade of rejection by pathology. Creatinine, serum creatinine; FU, follow-up; tacrolimus, trough serum levels of tacrolimus.

