
FIGURE 1.
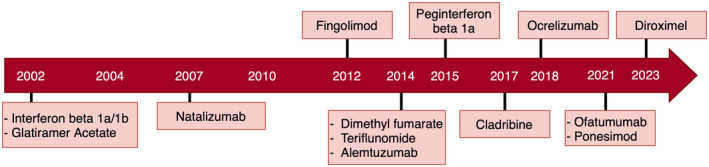
Schematic diagram illustrating the UK year of approval of each disease‐modifying therapy during the study period.
Official websites use .gov
A
.gov website belongs to an official
government organization in the United States.
Secure .gov websites use HTTPS
A lock (
) or https:// means you've safely
connected to the .gov website. Share sensitive
information only on official, secure websites.
Schematic diagram illustrating the UK year of approval of each disease‐modifying therapy during the study period.