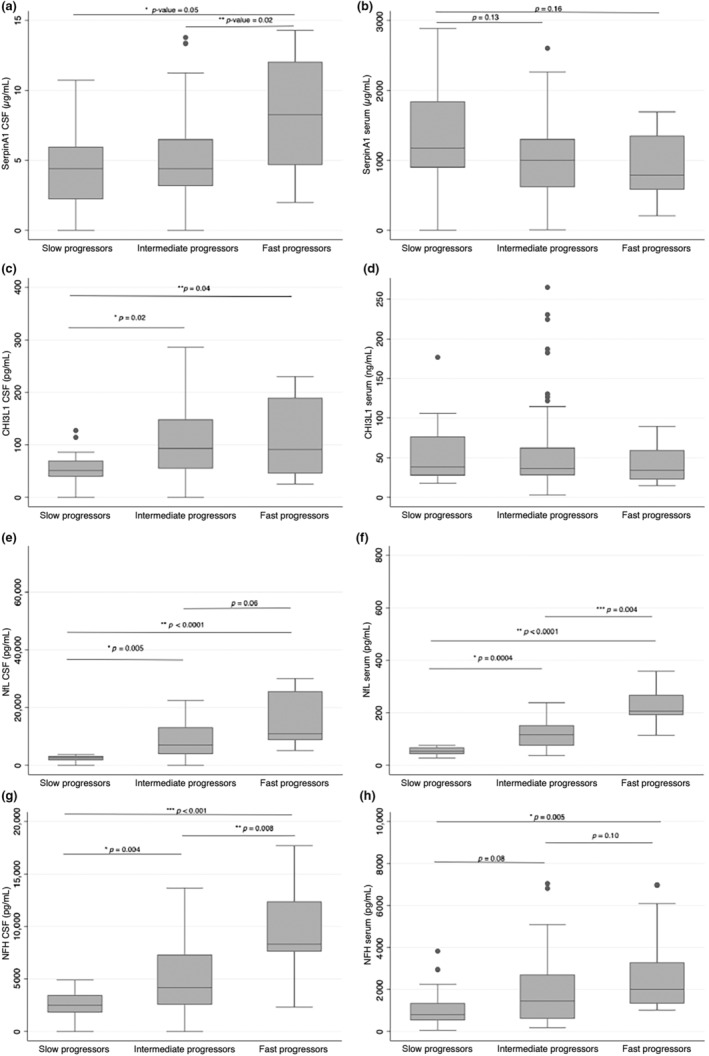
FIGURE 1.

Comparisons of biomarker levels across different classes of progressors. (a, b) Box plots of SerpinA1 concentrations in cerebrospinal fluid (CSF) and serum, respectively, according to slow, intermediate, and fast progressors. (c, d) Box plots of chitinase‐3‐like protein‐1 concentrations in CSF and serum, respectively, according to slow, intermediate, and fast progressors. (e, f) Box plots of neurofilament light chain concentrations in CSF and serum, respectively, according to slow, intermediate, and fast progressors. (g, h) Box plots of neurofilament light chain concentrations in CSF and serum, respectively, according to slow, intermediate, and fast progressors. All boxes display medians with interquartile ranges, outliers are shown as separate dots. CHI3L1, chitinase‐3‐like protein‐1; CSF, cerebrospinal fluid; NfL, neurofilament light chain; NfH, neurofilament heavy chain.
