FIGURE 2.

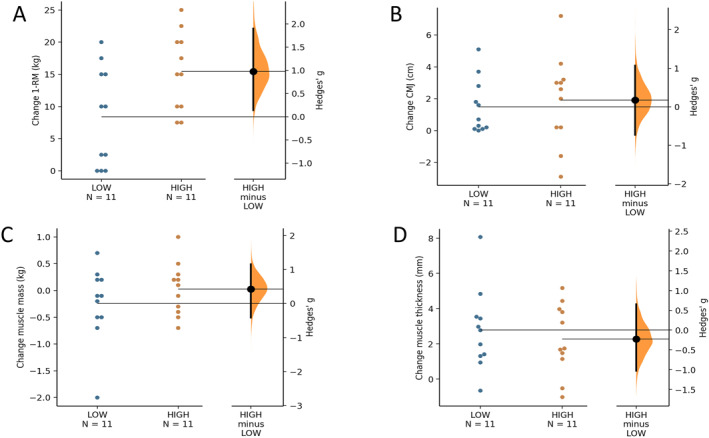
Estimation plot showing individual changes within‐ (from pre to post) and effect size between the groups in 1‐RM squat (A), CMJ (B), muscle mass (C), and muscle thickness (D).

Estimation plot showing individual changes within‐ (from pre to post) and effect size between the groups in 1‐RM squat (A), CMJ (B), muscle mass (C), and muscle thickness (D).