
FIGURE 2.
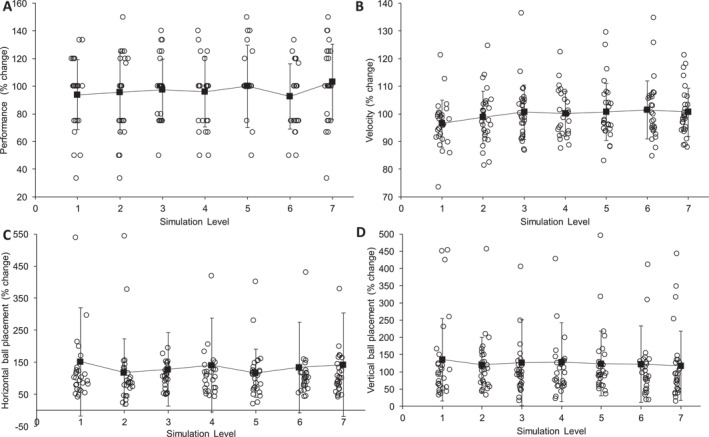
Comparing percentage change at each simulation level for all dependent variables (performance (A), velocity (B), horizontal ball placement (C) and vertical ball placement (D)) compared to habitual (control condition).
Official websites use .gov
A
.gov website belongs to an official
government organization in the United States.
Secure .gov websites use HTTPS
A lock (
) or https:// means you've safely
connected to the .gov website. Share sensitive
information only on official, secure websites.
Comparing percentage change at each simulation level for all dependent variables (performance (A), velocity (B), horizontal ball placement (C) and vertical ball placement (D)) compared to habitual (control condition).