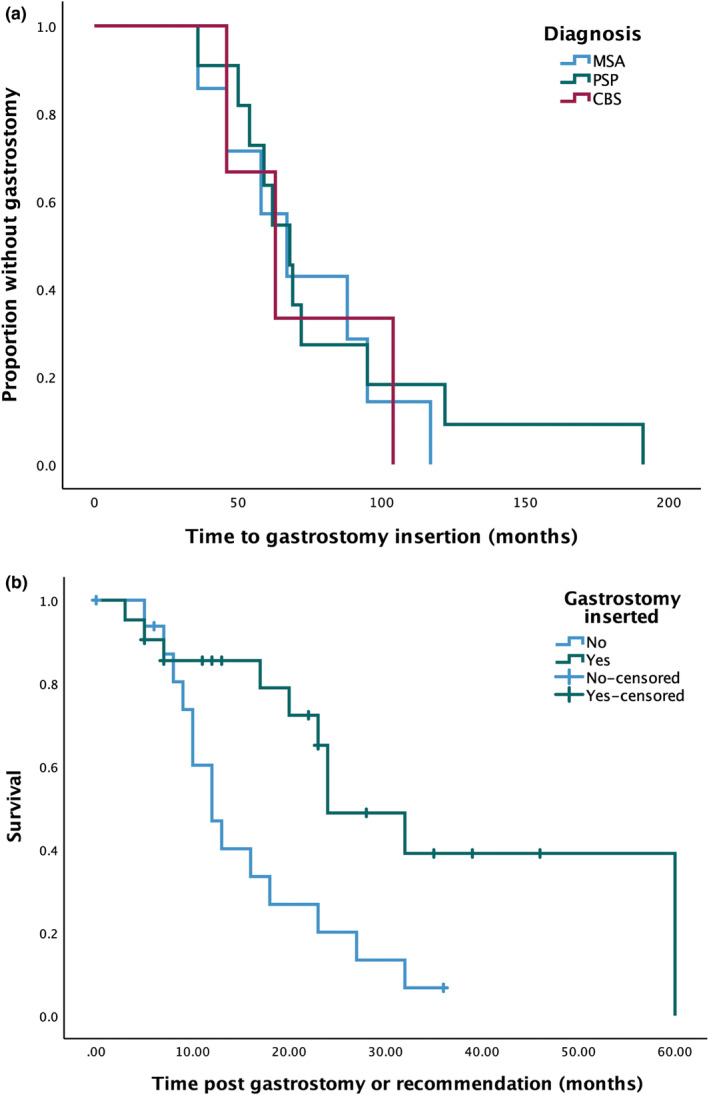
FIGURE 2.

Kaplan–Meier curves showing (a) time to gastrostomy insertion from disease onset in those who underwent the procedure and (b) survival following recommendation for gastrostomy or procedure, stratified by whether gastrostomy was performed. CBS, corticobasal syndrome; MSA, multiple system atrophy; PSP, progressive supranuclear palsy.
