
FIGURE 3.
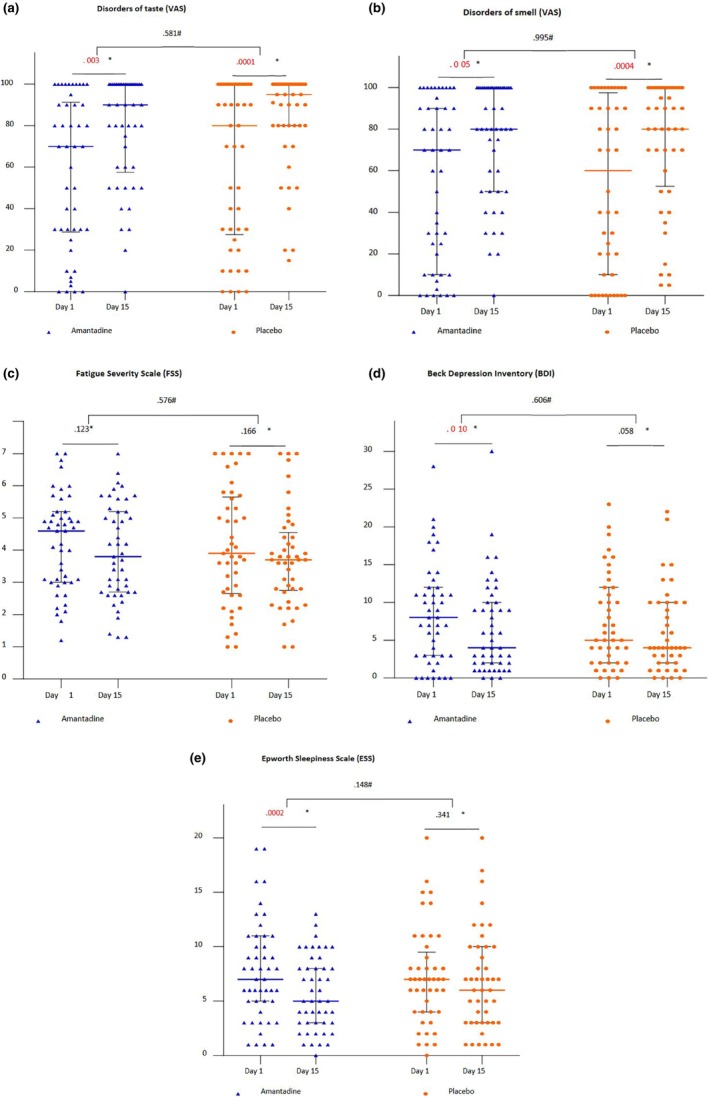
Neurological outcomes. The range of changes between Day 15 and Day 1 in each study arm based on the results of various scales: (a) disorder of taste (VAS); (b) disorder of smell (VAS); (c) fatigue (FSS); (d) depression (BDI); and (e) sleepiness (ESS). *Intra‐group change (Wilcoxon test). #Difference in change between groups (Mann–Whitney test). Lines with error bars represent medians with interquartile ranges. BDI, Beck Depression Inventory; ESS, Epworth Sleepiness Scale; FSS, Fatigue Severity Scale; VAS, visual analogue scale.