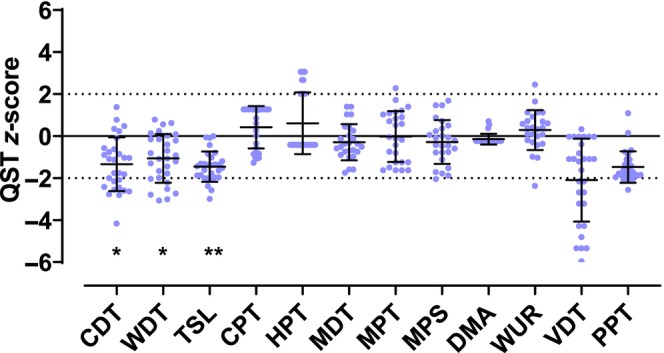
FIGURE 1.

Quantitative sensory testing of all patients. QST z scores of the SFN patients (mean/SD at the lateral calf). The zero line denotes the mean value of the control group, the dashed lines in each case 1.96 times the standard deviation from the mean value of the control group, i.e., the range in which the values of the control group lie within a 95% probability (95% confidence interval). Negative z scores denote loss of sensitivity. The asterisks denote the significant differences of the raw data between patients and control group: CDT p < 0.001, WDT p < 0.001, TSL p < 0.00, VDT p = 0.033 (*p < 0.05; **p < 0.001). CDT, cold detection threshold; CPT, cold pain threshold; DMA, dynamical mechanical allodynia; HPT, heat pain threshold; MDT, mechanical detection threshold; MPS, mechanical pain sensitivity; MPT, mechanical pain threshold; PPT, pressure pain threshold; TSL, thermal sensory limen; VDT, vibration detection threshold; WDT, warm detection threshold; WUR, wind‐up ratio.
