
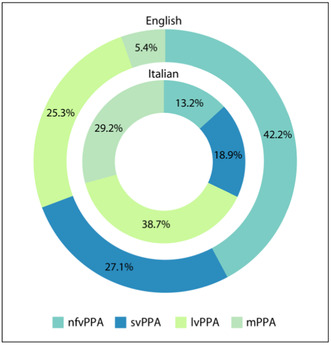
Donut plots showing proportion of PPA variants in English and Italian cohorts. Significant differences between cohorts are coded as follows: *p < 0.05 ***p < 0.001
Official websites use .gov
A
.gov website belongs to an official
government organization in the United States.
Secure .gov websites use HTTPS
A lock (
) or https:// means you've safely
connected to the .gov website. Share sensitive
information only on official, secure websites.
Donut plots showing proportion of PPA variants in English and Italian cohorts. Significant differences between cohorts are coded as follows: *p < 0.05 ***p < 0.001