
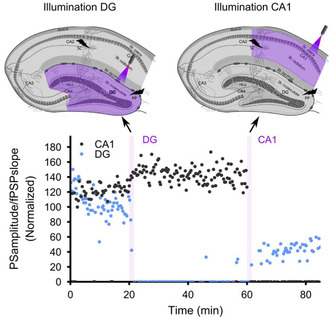
FIGURE 2 cCPA and focal illumination of DG or CA1 results in a decreased excitability (PS amplitude to fPSP slope) selectively in the illuminated region (n = 1).
Official websites use .gov
A
.gov website belongs to an official
government organization in the United States.
Secure .gov websites use HTTPS
A lock (
) or https:// means you've safely
connected to the .gov website. Share sensitive
information only on official, secure websites.
FIGURE 2 cCPA and focal illumination of DG or CA1 results in a decreased excitability (PS amplitude to fPSP slope) selectively in the illuminated region (n = 1).