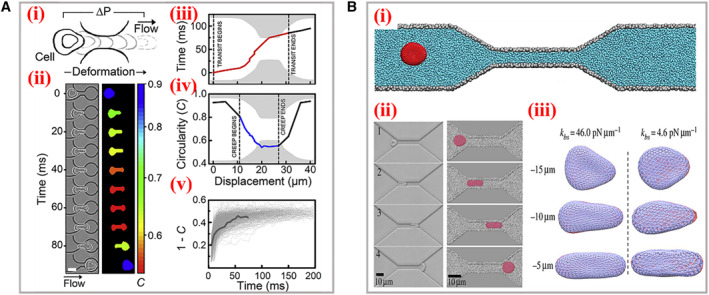
FIGURE 3.

Optical imaging of the cell deformation process. (A) Scheme (i) and time sequence (ii) of a single cell passaging through the micron‐constriction with a pressure‐driven flow. (iii‐v) The characteristic parameters achieved during deformation. Reproduced with permission. 16 Copyright 2017, Biophysical Society. (B) (i) Schematic representation of a red blood cell traversing across the microchannel. (ii) The experimental images (left) and simulation (right) data of the cellular shape during the traversing process. (iii) Bilayer–cytoskeletal detachment for the cell at different elastic interactions. Reproduced with permission. 18 Copyright 2014, The Authors, published by the Royal Society.
