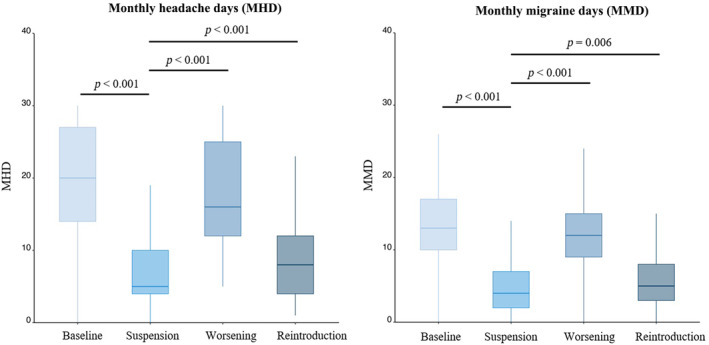
FIGURE 2.

Box plot illustrating the evolution of monthly migraine days (MMD) and monthly headache days (MHD) at the four time points of the study. T‐suspension (final month of the first period) was established as a reference for statistical analysis. The data reveal a pattern in which MMD decrease following the initial introduction of treatment, increase after suspension, and subsequently decrease again upon reintroduction.
