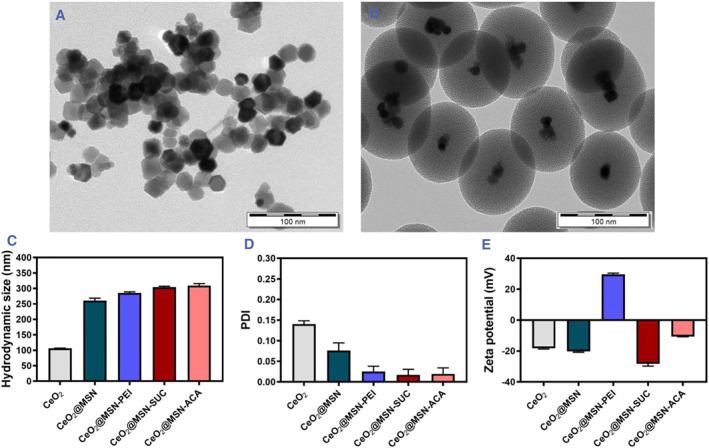
FIGURE 1.

Characterization of nanoparticle morphology and surface functionalization using TEM and DLS. (A) TEM image of CeO2 NPs (scale bar 100 nm). (B) TEM image of CeO2@MSNs (scale bar 100 nm). (C) Hydrodynamic size, (D) PDI and (E) ζ‐potential of CeO2, CeO2@MSN, CeO2@MSN‐PEI, CeO2@MSN‐SUC and CeO2@MSN‐ACA at pH 7.2. DLS, dynamic light scattering; NPs, nanoparticles; PDI, polydispersity index; TEM, transmission electron microscopy.
