
FIGURE 2.
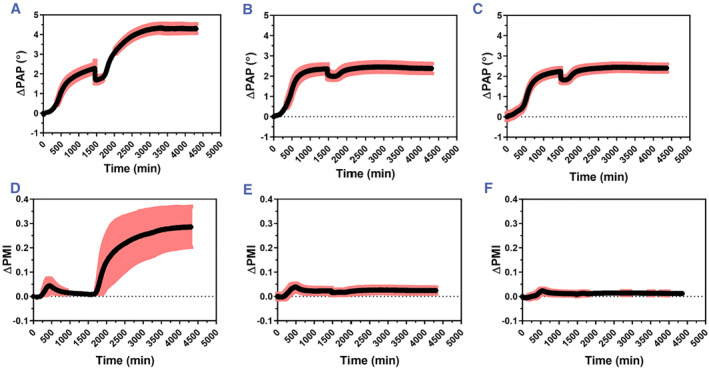
Average of real‐time MP‐SPR responses of the ΔPAP (upper graphs) and the ΔPMI (lower graphs) during Staphylococcus aureus bacterial biofilm growth (time: 0–1300 min) and interaction of differently charged NPs (from t = 1300 min and onwards). (A) ΔPAP and (D) ΔPMI of biofilm growth and interaction with CeO2@MSN‐PEI (N = 3). (B) ΔPAP and (E) ΔPMI of biofilm growth and interaction with CeO2@MSN‐SUC (N = 3). (C) ΔPAP and (F) ΔPMI of biofilm growth and interaction with CeO2@MSN‐ACA (N = 3). MP‐SPR, multi‐parametric surface plasmon resonance; NPs, nanoparticles; ΔPAP, peak angular position; ΔPMI, peak minimum intensity.