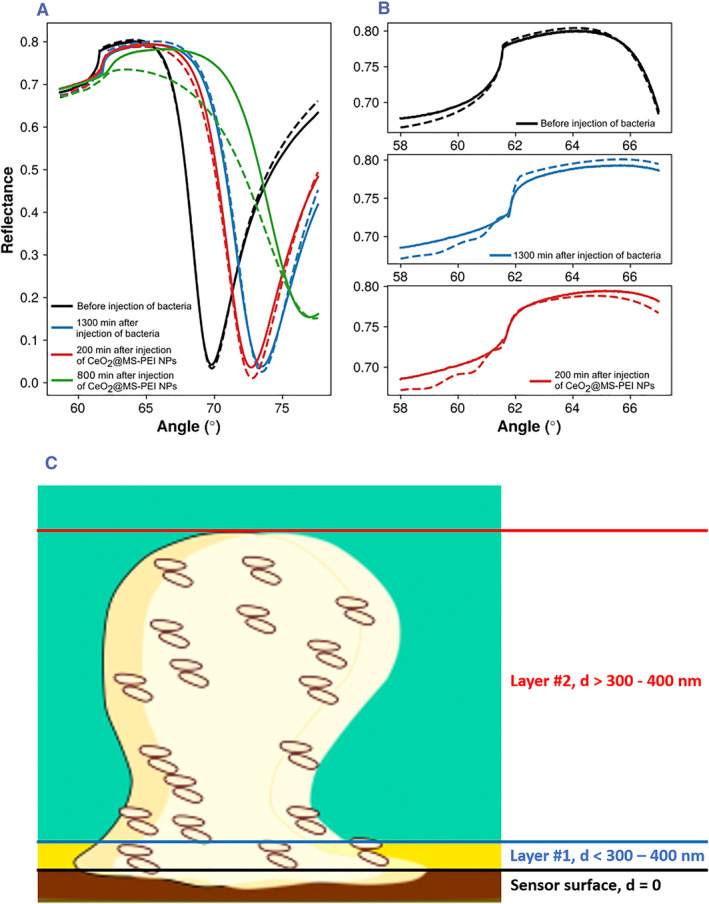
FIGURE 3.

(A) MP‐SPR reflectance spectra 5 min before the injection of bacteria (black), t = 1300 min after the start of the injection of bacteria (blue), 200 min (red, time = 1500 min in Figure 2A) and 800 min (green, t = 2100 min in Figure 2A) after the start of the injection of CeO2@MSN‐PEI NPs. (B) Total internal reflection angle region of the data shown in panel (A). All data are for the 670 nm wavelength, and dotted lines indicate the optical (Fresnel) fits to the measured data. (C) Schematic representation of the sample layers used in the optical modeling of the full SPR reflectance spectra. MP‐SPR, multi‐parametric surface plasmon resonance; NPs, nanoparticles.
