
FIGURE 5.
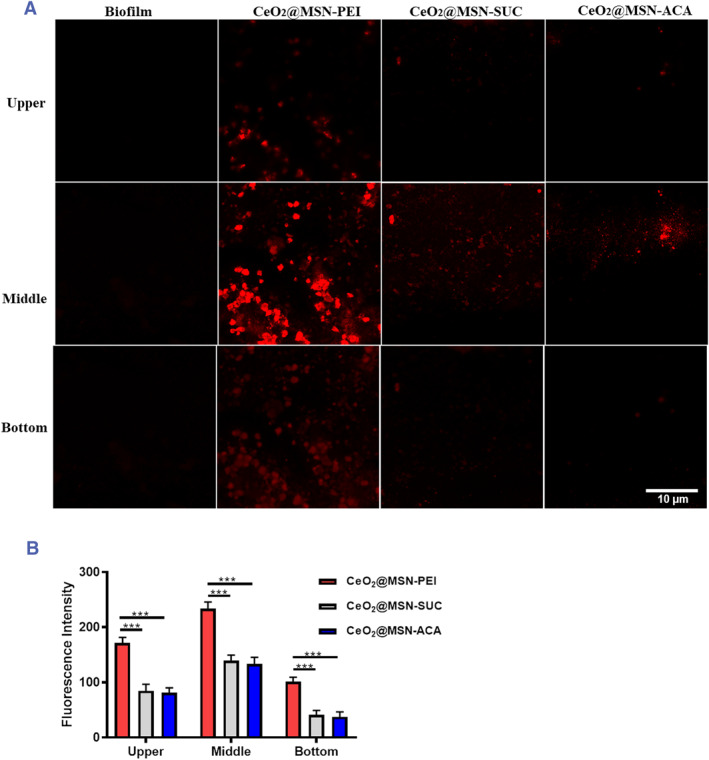
(A) Confocal microscope image stacks of plain biofilm (first column of images) and biofilm exposed with differently charged labeled CeO2@MSN‐PEI (second column of images), CeO2@MSN‐SUC (third column of images) and CeO2@MSN‐ACA (fourth column of images). (B) Quantitative analysis of the image stack of biofilm after exposure with differently charged labeled CeO2@MSN‐PEI, CeO2@MSN‐SUC and CeO2@MSN‐ACA (N = 3, ***P < 0.001).