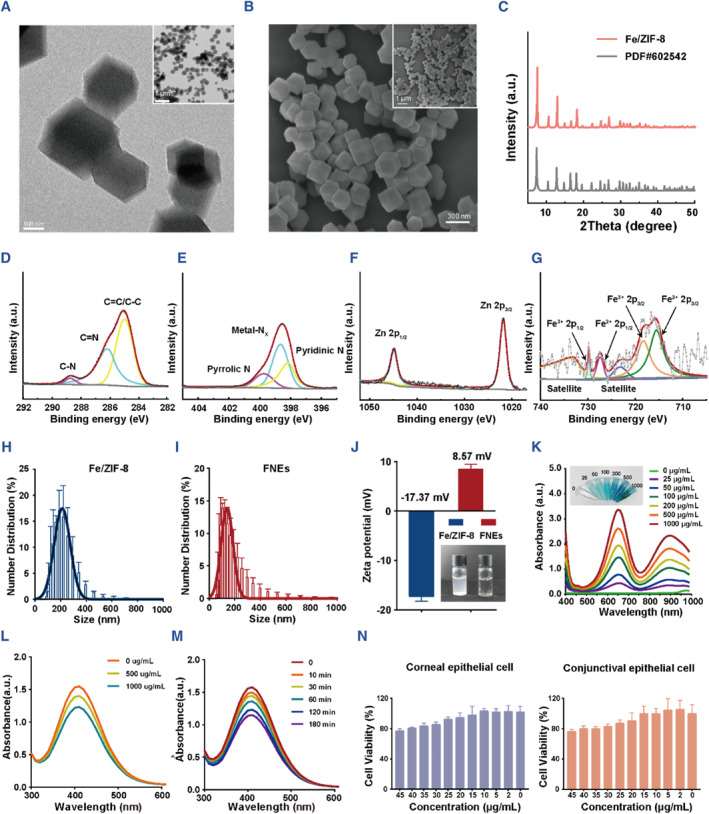
FIGURE 2.

Characterization of Fe/ZIF‐8 and FNEs. (A) TEM images and (B) SEM images of Fe/ZIF‐8. (C) XRD pattern of Fe/ZIF‐8. C (D), N (E), Zn (F) and Fe (G) XPS spectrums of Fe/ZIF‐8. Particle size of Fe/ZIF‐8 (H) and FNEs (I). (J) Zeta potential of Fe/ZIF‐8 and FNEs. (K) Absorbance curves of TMB‐oxide after incubation with FNEs of varied concentrations. The image inserted is the corresponding TMB‐oxide color change. FNEs concentration‐dependent (L) and time‐dependent (M) decomposition of H2O2 using Ti(SO4)2. (N) Human corneal epithelial cell and human conjunctival epithelial cell viabilities after culturing with FNEs for 24 h.
