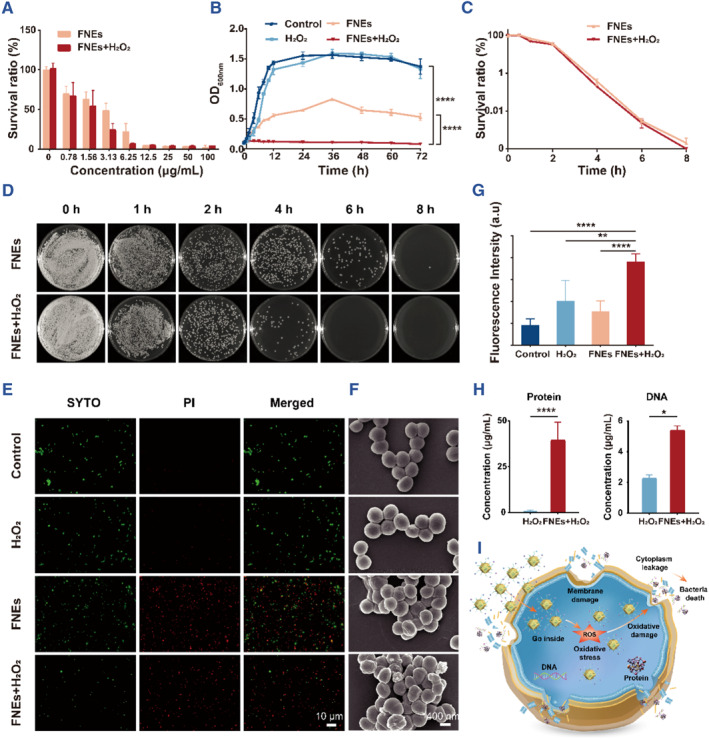
FIGURE 3.

Antibacterial effect of FNEs in vitro. (A) MICs of FNEs with or without H2O2 (10 nM) of S. aureus, (B) Growth kinetics of S. aureus with different treatments, (C) the corresponding growth‐inhibit curve, and (D) the corresponding plate counting assays. (E) Fluorescent Live/Dead images of S. aureus and (F) the corresponding SEM images with different treatments. (G) ROS generation level of different treatments in S. aureus. (H) Protein leakage and DNA leakage of S. aureus with different treatments. (I) Antibacterial mechanism schematic diagram of FNEs against S. aureus. The asterisks indicate significant differences (t‐test, *p ≤ 0.05; **p ≤ 0.01; ****p ≤ 0.0001).
