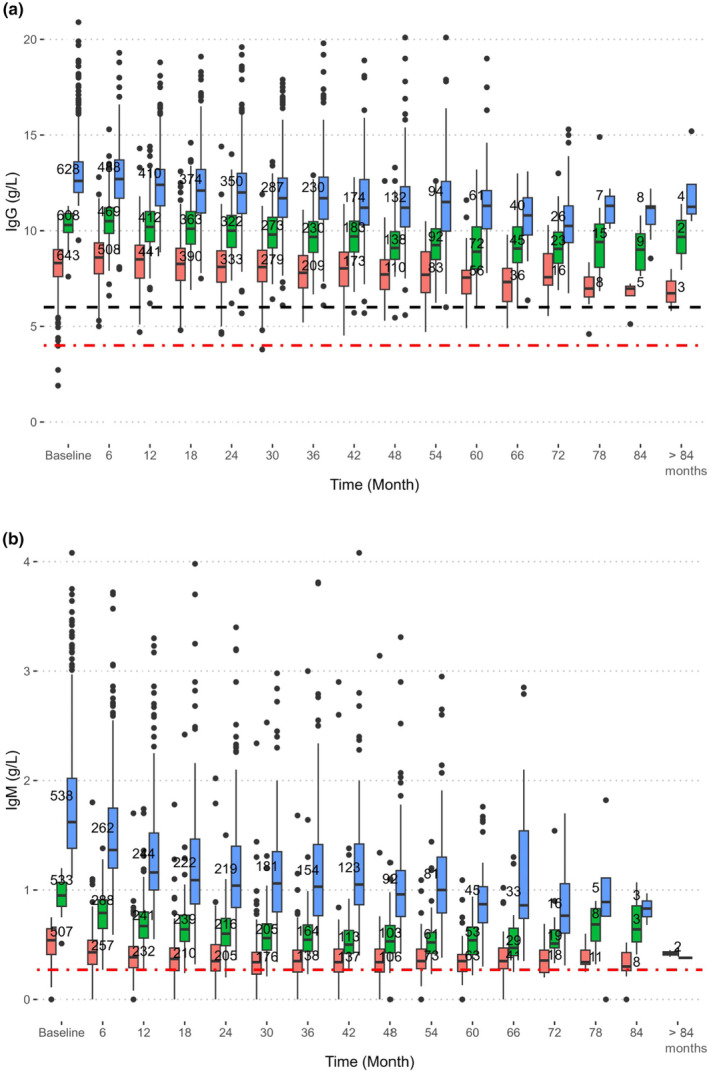
FIGURE 2.

Individuals with higher baseline IgG (a) or IgM (b) tended rather to decline faster in IgG upon a similar rituximab challenge over time compared to individuals with lower baseline values. The boxes display the median and interquartile range (IQR) at each time point. Whiskers denote 1 . 5 × IQR and dots indicate outliers. The dashed black line indicates the lower limit of normal (LLN) for IgG at our laboratory (6.7 g/L). The red dash‐dot line in (a) indicates the level of severe hypogammaglobulinaemia (<4 g/L) and in (b) LLN (0.27 g/L).
