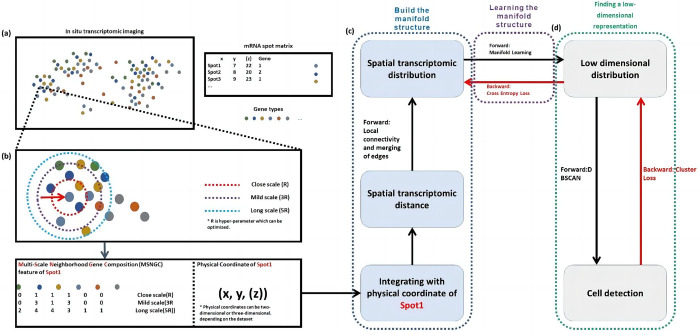
Fig 1. The diagram of ST-CellSeg for cell segmentation.
The ST-CellSeg cell segmentation algorithm has three stages. (a) A spatial transcriptomic data structure. Each spatial transcriptome sampling site includes a gene tag and physical coordinates, which can be two-dimensional or three-dimensional. (b) Illustration of multi-scale neighbourhood gene composition (MSNGC). MSNGC is a spot feature that counts the number of adjacent genes at different scale levels and represents the gene relationship between the sampling point and its surroundings. Given MSNGC features and physical coordinates of spots, ST distances are calculated, which represent the spatial location of sampling points. (c-d) An ST-CellSeg cell segmentation framework. Spatial transcriptomic manifolds are built in (c). Local connectivity and merging edges are combined to build a manifold structure. The low dimensional clustering space is constructed from manifold learning. (d) Cell segmentation (or cell detection) results are obtained from density clustering in the clustering space. Fusion cross-entropy and clustering analysis metrics are used as error propagation.

