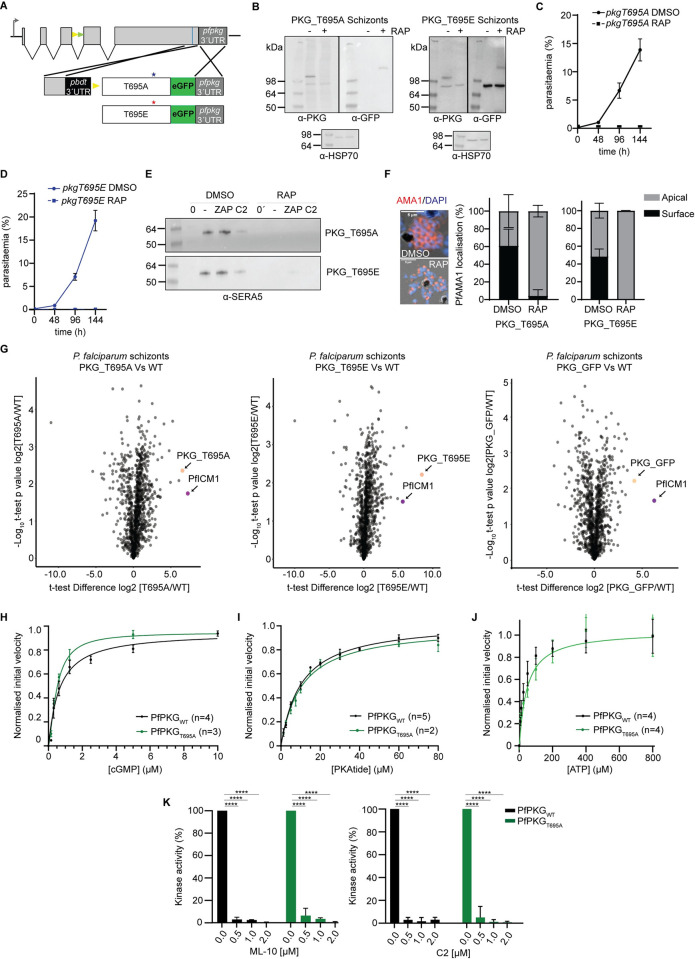
Fig 4. Phosphomutant and phosphomimetic modifications of T695 interfere with PfPKG function in the parasite but do not affect kinase activity.
(A) Schematic of the approach used to create lines pkgT695A and pkgT695E. Blue line indicates the position targeted by the gRNA. Stars depict the relative positions of the mutated amino acids. (B) Western blot analysis of PKG_T695A and T695E schizonts in the absence or presence of rapamycin (RAP). HSP70 was used as a loading control (C, D) Replication rates over three cycles of lines pkgT695A and pkgT695E. Error bars, ± S.D (n = 3). (E) Egress assay of parasites pkgT695A and pkgT695E, showing no release of SERA5 P50 into culture supernatants of RAP-treated schizonts even upon addition of zaprinast (ZAP) consistent with impaired egress. (F) Representative IFA image of pkgT695A parasites showing translocated AMA1 in DMSO-treated merozoites or micronemal AMA1 in RAP-treated merozoites. Right: Quantification of AMA1 relocalization in both pkgT695A and pkgT695E (n = 2, >150 schizonts were quantified in each). Values, means ± SD. (G) Volcano plots showing quantification of proteins identified by quantitative MS in pull-downs from PKG-GFP, PKG_T695A and PKG_T695E compared to WT (control) parasites (n = 2). Significance (Student’s t test) is expressed as log10 of the P value (y axis). Enrichment of interaction partners compared to controls (x axis). PKG is indicated (magenta dot) as well as ICM1 (orange dot). (H, I and J) cGMP KA determination, PKAtide Km determination and ATP Km determination of recombinant PfPKGT695A (in green), relative to the control (PfPKGWT in black). Means ± SEM (see S1 Data). (K) Kinase activity of PfPKGWT and PfPKGT695A in the presence of the established PKG inhibitors ML-10 (left panel) and C2 (right panel). Means ± SD, Two-way ANOVA with P<0.0001 (****).

