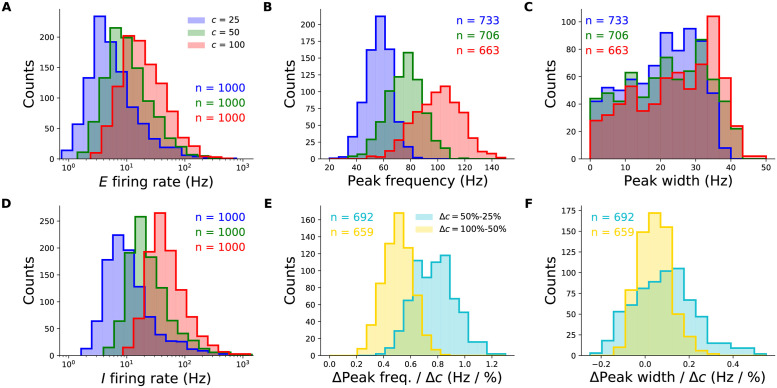
Fig 2. Robustness of the contrast-dependence of gamma peak frequency to network parameter variations.
One thousand 2-population SSN’s were simulated with randomly sampled parameters (but conditioned on producing stable noise-free steady-states), across wide biologically plausible ranges. All histograms show counts of sampled networks; the total numbers (n’s) vary across different histograms, as different subsets of network produced the corresponding feature or value in the corresponding condition (e.g., a gamma peak at 50% contrast). A: Distributions of the excitatory unit’s firing rate in response to 25%, 50%, and 100% contrast stimuli (blue, green, red), plotted on a logarithmic scale. 100% of networks shown across all contrasts. B: Distributions of the gamma peak frequencies at different stimulus contrasts. The n’s (upper right) give the number of networks with a power spectrum peak above 20 Hz. C: Distributions of the gamma peak widths at different stimulus contrasts. D: Same as panel A, but for the inhibitory unit. E: Distributions of the change in gamma peak-frequency normalized by the change in stimulus contrast, either 25% and 50% (cyan) or 50% and 100% (yellow). F: Same as panel E, but for gamma peak-width.

