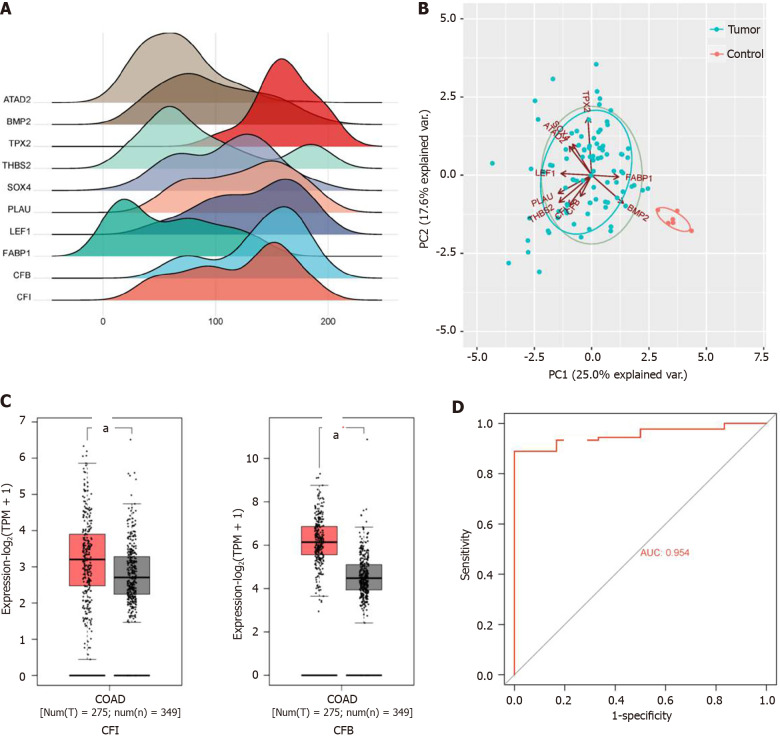
Figure 2.
Bioinformatics analysis of key genes. A: Ridge line graph of hub gene expression. Horizontal coordinate indicates gene expression, and the height of the mountain range graph indicates sample abundance; B: Plot of principal component analysis of hub genes. Dots represent samples, and different colors indicate different subgroups; C: Validation of complement factor I (CFI) and complement factor B expression levels in colon cancer tissues in the GEPIA 2 database. aP < 0.05 vs normal tissues; D: Receiver operating characteristic curve plot of CFI. Horizontal coordinate represents false positive rate and vertical coordinate represents true positive rate. BMP2: Bone morphogenetic protein-2; SOX4: SRY-related high-mobility-group box 4; LEF1: Lymphoid enhancer binding factor 1; FABP1: Fatty acid-binding protein 1; AUC: Area under the receiver operating characteristic curve; CFI: Complement factor I; CFB: Complement factor B.

