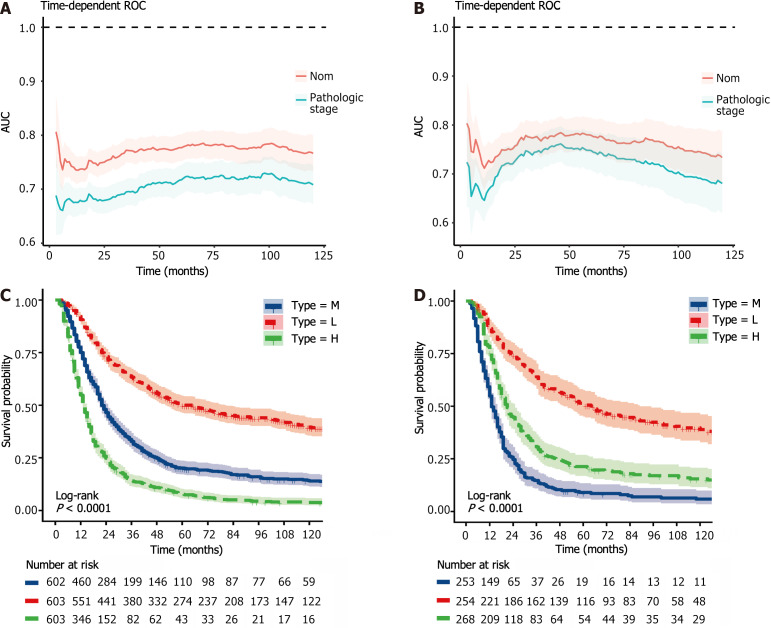
Figure 13.
Comparison of area under the receiver operating characteristic curves for the nomogram and pathological staging using time-dependent receiver operating characteristic curves. A: In the training set; B: In the test set. Kaplan–Meier survival curves of the high-risk, middle-risk and low-risk groups; C: In the training set; D: In the test set.

