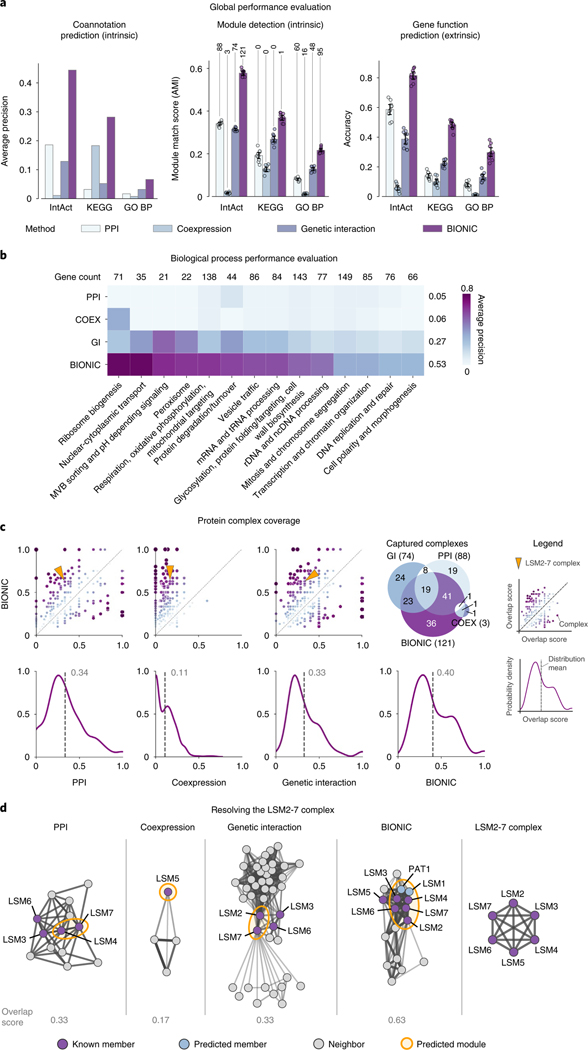
Fig. 2 |. Comparison of BIONIC integration to three input networks.
a, Functional evaluations for three yeast networks, and unsupervised BIONIC integration. Data are presented as mean values. Error bars indicate the 95% confidence interval for independent samples. Number of captured modules are indicated above the module detection bars as determined by a 0.5 overlap (Jaccard) score cutoff. b, Evaluations over high-level functional categories, split by category. Numbers above columns indicate gene overlap with integration results and the average performance of each method is reported (right of each row). c, Top row: comparison of overlap scores between known complexes and predicted modules. Each point is a protein complex. The axes indicate the overlap (Jaccard) score, where 0 indicates no members of the complex were captured, and 1.0 indicates the complex was captured perfectly. The diagonal indicates equivalent performance. Points above the diagonal are complexes where BIONIC outperforms the given network, and points below the diagonal are complexes where BIONIC underperforms. The arrows indicate the LSM2–7 complex, shown in d. A Venn diagram describes the overlap of captured complexes (score of 0.5 or higher) between the input networks and BIONIC integration. Numbers in brackets denote the total captured complexes for each method. Bottom row: the distribution of overlap scores between predicted and known complexes. The dashed line indicates the mean. d, Functional relationships between predicted LSM2–7 complex members and genes in the local neighborhood, as given by the three input networks and BIONIC integration. The predicted cluster best matching the LSM2–7 complex in each network is circled. The overlap score of the predicted module with the LSM2–7 complex is shown. Edges correspond to protein–protein interactions in PPI20, Pearson correlation between gene profiles in coexpression21 and genetic interaction22 networks, and cosine similarity between gene features in the BIONIC integration. The complete LSM2–7 complex is depicted on the right. Edge weight corresponds to the strength of the functional relationship. PPI, protein–protein interaction; COEX, coexpression; GI, genetic interaction; BP, biological process.

