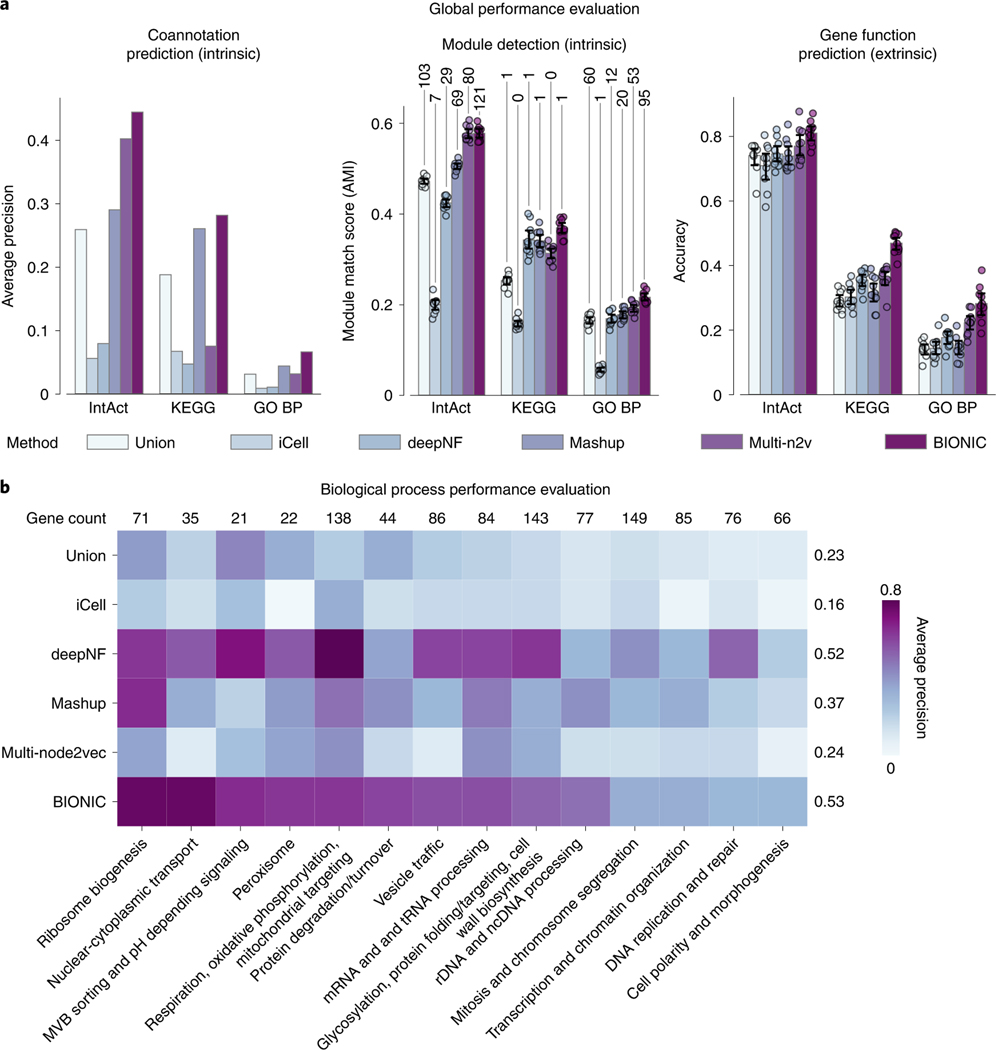
Fig. 3 |. Comparison of BIONIC to existing integration approaches.
a, Coannotation prediction, module detection and gene function prediction evaluations for three yeast networks integrated by the tested unsupervised network integration methods. The input networks and evaluation standards are the same as in Fig. 2. Data are presented as mean values. Error bars indicate the 95% confidence interval for independent samples. Numbers above the module detection bars indicate the number of captured modules, as determined by a 0.5 overlap (Jaccard) score cutoff. b, Evaluation of integrated features using high-level functional categories, split by category. Numbers above columns indicate gene overlap with integration results and the average performance of each method across categories is reported (right of each row). PPI, protein– protein interaction; BP, biological process.

