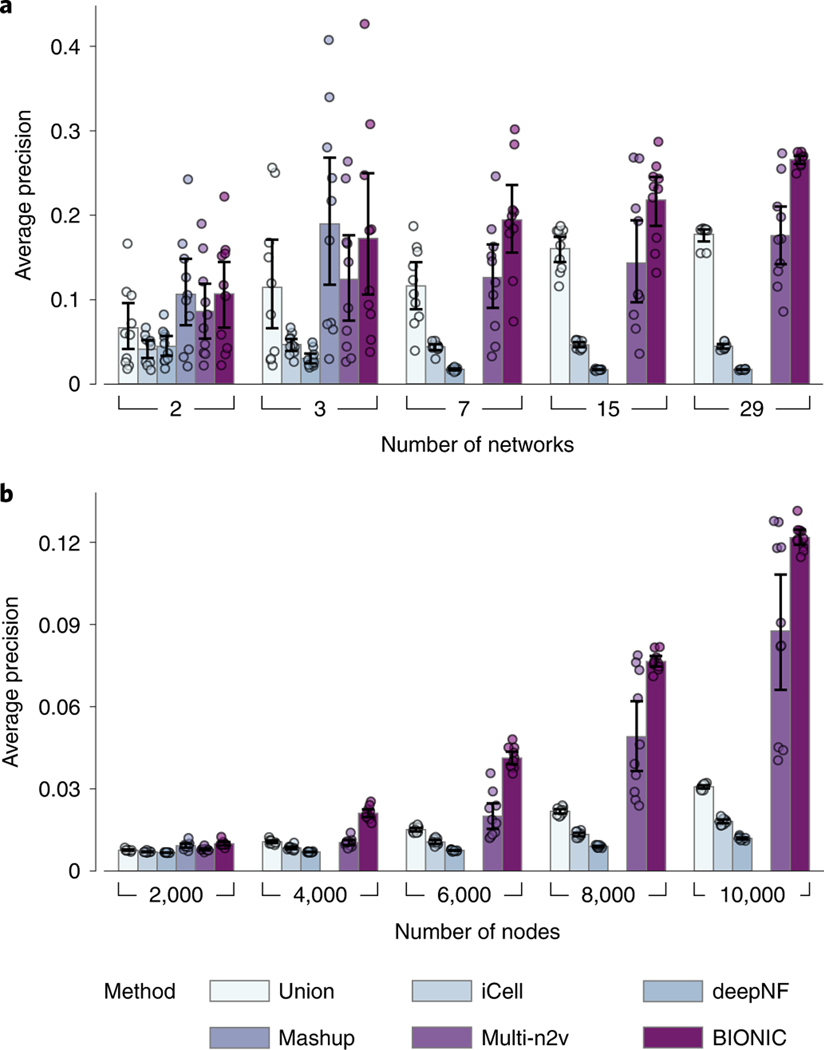
Fig. 5 |. Network quantity and network size performance comparison across integration methods.
a, Performance comparison of unsupervised integration methods across different numbers of randomly sampled yeast coexpression input networks on KEGG pathways gene coannotations. b, Performance comparison of unsupervised integration methods across four human protein–protein interaction networks for a range of subsampled nodes (genes) on CORUM complexes protein coannotations. In these experiments, the Mashup method failed to scale to seven or more networks (a) and 4,000 or more nodes (b), as indicated by the absence of bars in those cases (Methods). Data are presented as mean values. Error bars indicate the 95% confidence interval for independent samples. multi-n2v, multi-node2vec.

