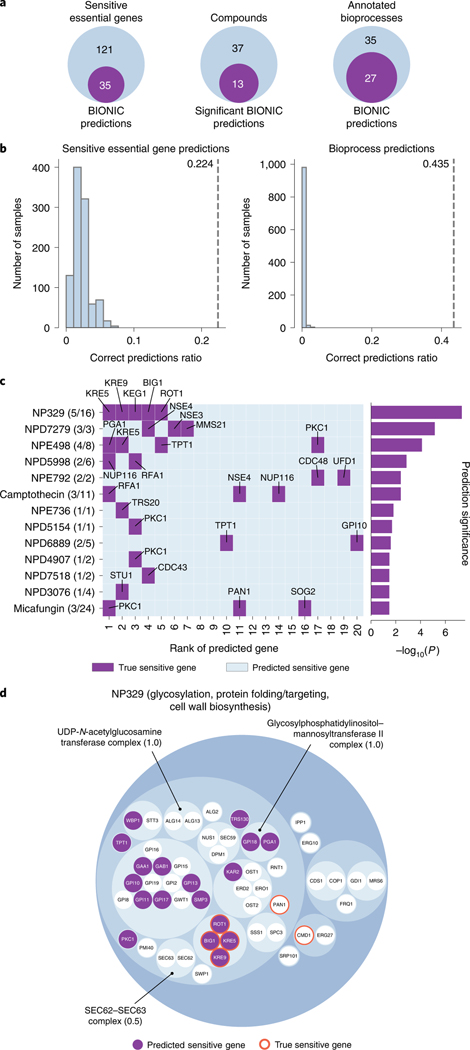
Fig. 6 |. BIONIC essential gene chemical–genetic interaction predictions.
a, From left to right, the number of correct unsupervised BIONIC sensitive essential gene predictions across the 50 screened compounds, the number of compounds BIONIC significantly predicted sensitive essential genes for (ordered Fisher’s exact test) and the number of correctly predicted sensitive essential gene annotated bioprocesses, based on the bioprocess enrichment of BIONIC predictions for each compound. b, A comparison of correctly predicted sensitive genes (left) and correctly predicted biological process annotations (right) between BIONIC predictions (dashed line) and random permutations of BIONIC features gene labels (histogram). Correct prediction ratio is the number of correct predictions divided by the number of total sensitive essential genes (left) or annotated biological processes (right) across the 50 screened compounds. c, Rank of BIONIC sensitive essential gene predictions for the 13 significantly predicted compounds. The number of correctly predicted genes out of total sensitive genes are shown in parentheses beside each compound name. The statistical significance of the BIONIC predictions for each compound is displayed in the bar plot on the right. d, Hierarchical organization of essential genes in the glycosylation, protein folding/targeting, cell wall biosynthesis bioprocess based on integrated BIONIC features. Smallest circles correspond to genes, larger circles indicate clusters of genes. Six genes sensitive to the NP329 compound are indicated with orange borders, and corresponding BIONIC predictions lying in the bioprocess are indicated as purple circles. Captured protein complexes in the bioprocess are annotated and the corresponding overlap score (Jaccard) with the true complex is given in parentheses. Source data for this figure are provided in Supplementary Data File 7.

