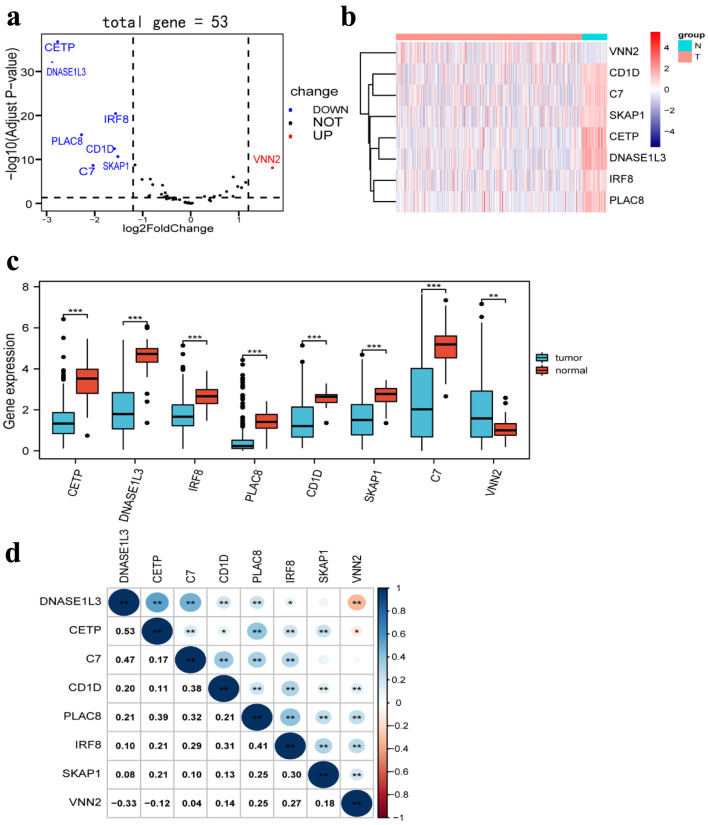
Figure 3.
Differentially expressed TLS-related genes between HCC tissues and normal tissues. (a) Volcano plot indicates TLS-related genes, with red dots indicating high expression and blue dots indicating low expression. (b) Heatmap of differentially expressed TLS-related genes, with red indicating high expression, blue indicating low expression, n representing normal tissues, and t representing tumor tissues. (c) Boxplots of differentially expressed TLS-related genes, with blue boxes representing tumor groups and red boxes representing normal groups. (d) The correlation of TLS-related genes with each other. TLS: tertiary lymphoid structures.

