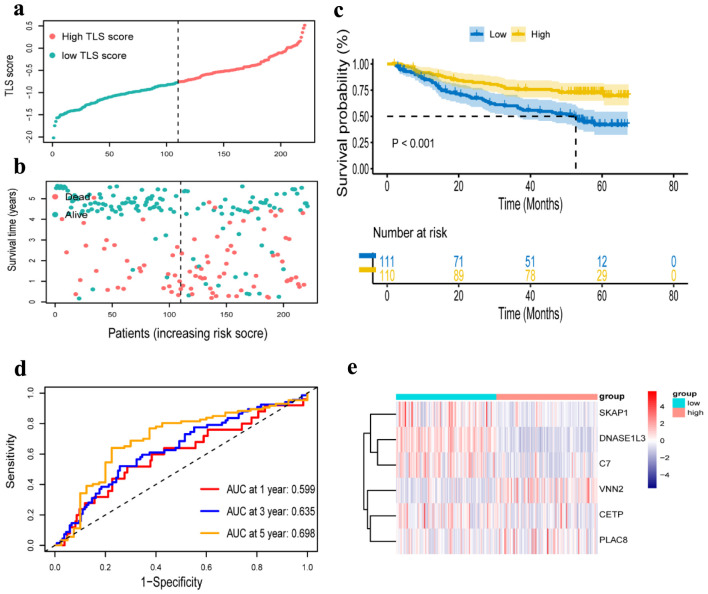
Figure 6.
Verification of a risk prognostic model in GSE14520 cohort. (a) The patients were equally divided into two groups according to the threshold of the median risk score. Blue represents the low TLS score group. Red represents the high TLS score group. (b) Survival status of patients with HCC in high and low risk groups. Blue represents survival. Red represents death. (c) Kaplan-Meier curves showing the overall survival of patients in the high TLS score and low TLS score groups. (d) The predictive efficiency of the risk score was verified by the ROC curve. (e) Heatmap showing the expression of the six TLS-related genes. Blue represents the low TLS score group. Red represents the high TLS score group. TLS: tertiary lymphoid structures.

