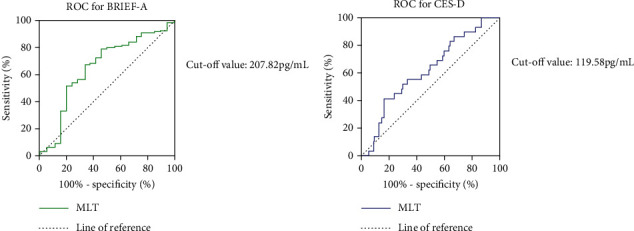
Figure 6.

The ROC for MLT grouped by different neuropsychiatric status. ROC curve was used to analyze the diagnostic significance of plasma MLT levels for cognitive impairment and depression status in T2DM patients, by distinguishing samples with T scores > 60 or CES-D score > 10. (a) The sensitivity and specificity of the ROC for BRIEF-A were 71.7% and 65.0%, and the cut-off value of MLT was 207.82 pg/mL. (b) The sensitivity and specificity of the ROC for CES-D were 83.5% and 41.4%, and the cut-off value was 119.58 pg/mL.
