Figure 2.
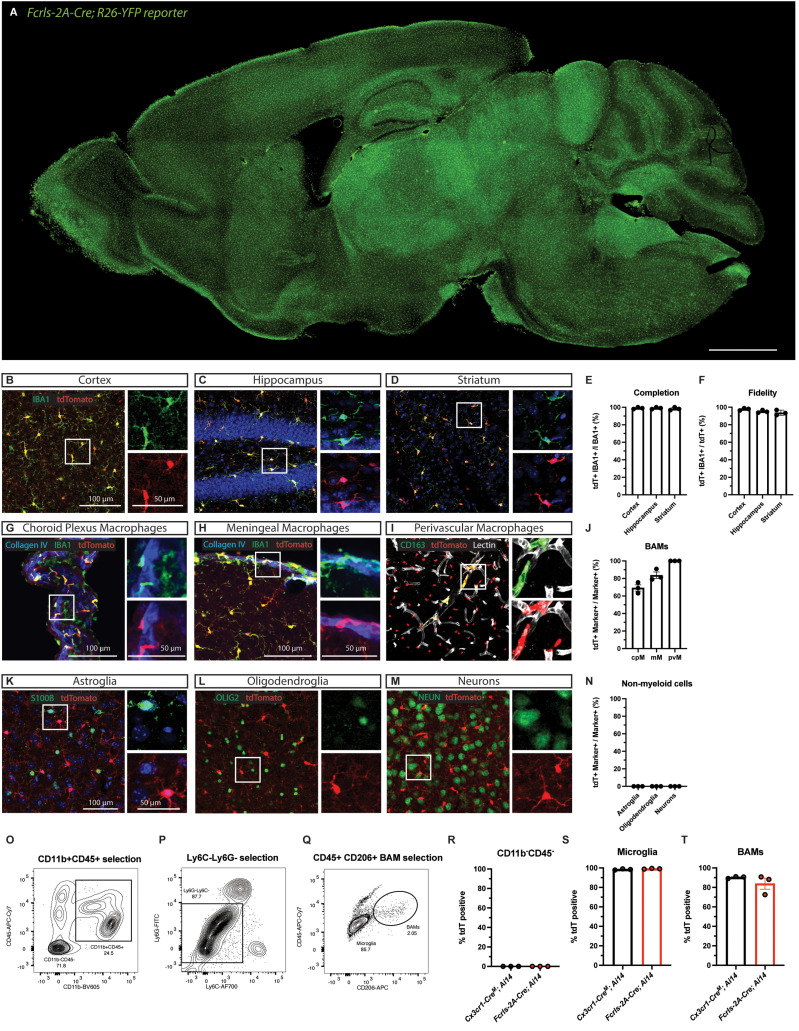
Fcrls-A-Cre mice effectively recombine floxed DNA in all microglia and most BAMs. A, Representative epifluorescence micrograph of immersion fixed brain of adult (2 months of age) Fcrls-2A-Cre+/−;R26YFP+/− reporter mice. Scale bar 1 mm. B–D, Representative confocal micrographs of immunostained slices from adult (1–4 months of age) Fcrls-2A-Cre+/−;Ai14+/v mice showing tdTomato due to Cre recombination (red) and microglia (green) in cortex, hippocampus, and striatum. E, F, Quantification of the completion and fidelity of Cre activity in IBA1+ parenchymal macrophages in the brain. N = 3 mice. G–I, Representative confocal micrographs of different BAM subsets, including choroid plexus macrophages (green, anatomical, Collagen IV-adjacent), meningeal macrophages (green, Collagen IV-adjacent), and perivascular macrophages (green, CD163+, Lectin-adjacent). J, Quantification of Fcrls-2A-Cre-mediated recombination in BAM subsets. N = 3 mice. K–M, Representative confocal micrographs of immunostaining for S100B (green, astroglia), OLIG2 (green, oligodendroglia), and NEUN (green, neurons) in slices from Fcrls-2A-Cre+/−;Ai14+/− mice. N, Quantification of Fcrls-2A-Cre-mediated recombination in non-myeloid brain cells (astroglia, oligodendroglia, neurons). N = 3 mice. O–Q, Representative flow cytometry density plots showing gating of microglia (CD11b+CD45loLy6C−Ly6G-CD206−) and BAMs (CD11b+CD45+Ly6C−Ly6G−CD206+). R–T, Quantification of Fcrls-2A-Cre- or Cx3cr1-CreM-mediated (as positive control) recombination in CD11b−CD45− non-myeloid cells, microglia, and BAMs. N = 3 mice per group.

