Figure 4.
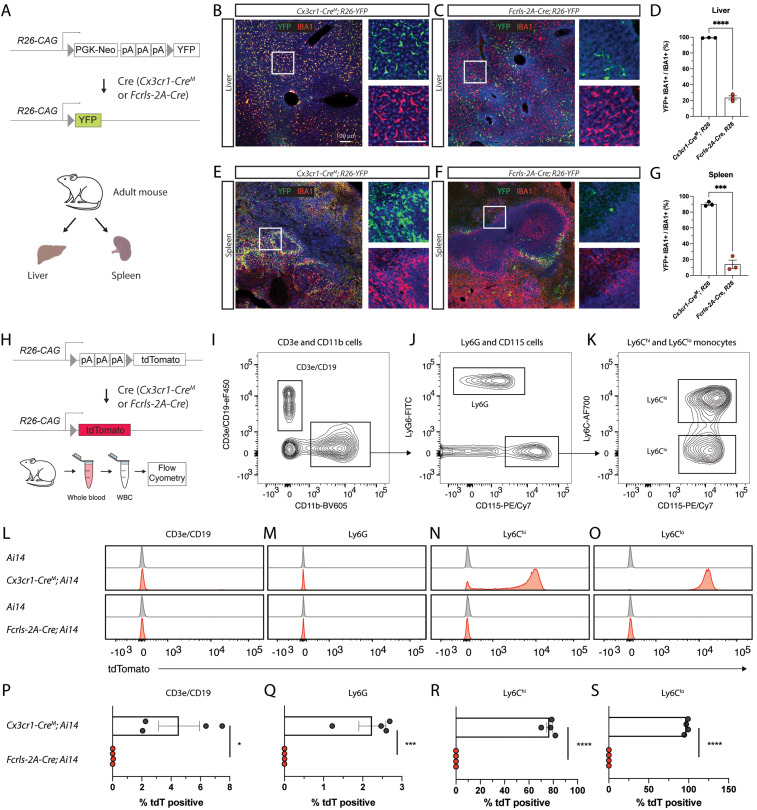
Fcrls-2A-Cre mice recombine floxed DNA in a subset of peripheral macrophages while completely sparing white blood cells. A, Schematic representation of recombination of R26-YFP reporter in crossings with Fcrls-2A-Cre and Cx3cr1-CreM (positive control) mice and organs harvested for immunostaining. B–C, Representative confocal micrographs of YFP fluorescence (green) and IBA1-immunostaining (red, macrophages) in the liver of adult animals. D, Quantification of YFP-positive macrophages in the liver. N = 3 per group. Unpaired t test. ***p < 0.0001. E, F, Representative confocal micrographs of YFP fluorescence (green) and IBA1-immunostaining (red, macrophages) in the spleen of adult animals. G, Quantification of YFP-positive macrophages in the spleen. N = 3 per group. Unpaired t test. ***p < 0.0002. H, Schematic representation of recombination of Ai14 reporter in crossings with Fcrls-2A-Cre and Cx3cr1-Cre (positive control) mice and white blood cell harvesting for flow cytometry. I–K, Representative flow cytometry density plots showing gating for lymphocytes (CD11b-CD19 + CD3e+), granulocytes (CD11b + Ly6G+), and monocytes (CD115+Ly6Chi and CD115+Ly6Clo). Pregated on single, live, CD45+ cells. L–O, Histograms showing tdTomato fluorescence among the different white blood cell subset populations for Ai14 controls, Cx3cr1-CreM; Ai14 mice, and Fcrls-Cre; Ai14 mice. P–S, Scatter plots showing the percentage of tdTomato-positive cells among all cells within a given subset in Cx3cr1M-Cre+/−;Ai14+/− mice, and Fcrls-2A-Cre+/−;Ai14+/− mice. N = 4 mice per group. Unpaired t test. *p = 0.0178, ***p = 0.0006, ****p < 0.0001.

