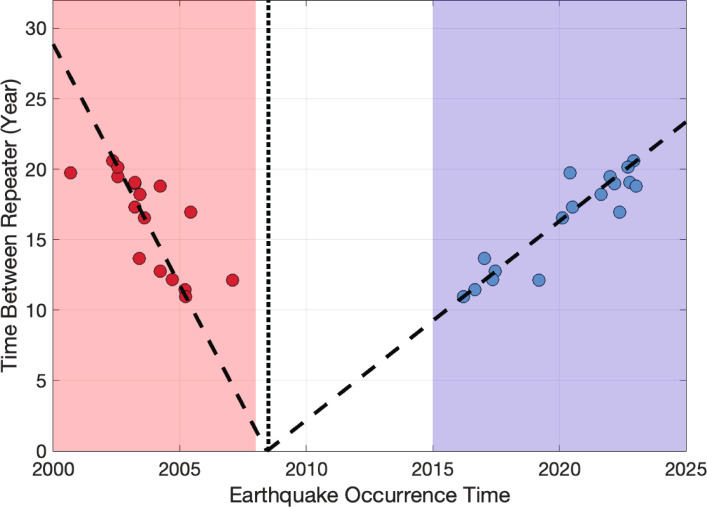
Extended Data Fig. 9. The red and blue dots mark the earlier and later events in similar-waveform repeating pairs.
The black dashed lines show the linear fitting with the lines constrained to meet at the x-axis, which are similar to Fig. 4. The light red area is the time when the inner core is seen to super-rotate, and the light blue area is sub-rotation. In between, matching pairs are less diagnostic, probably because inner core rotation slows as it is reversing, with minimal waveform changes.

