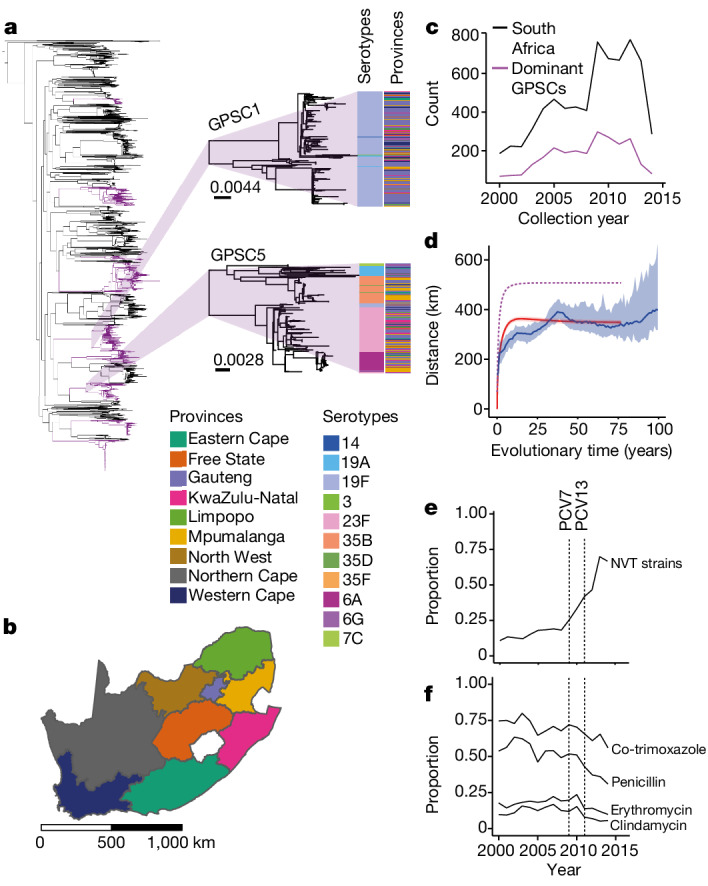
Fig. 1. Descriptive summary of S. pneumoniae isolates.

a, Phylogenetic tree of 6,910 South African isolates included in this study. Dominant GPSCs (n > 50) are in purple. GPSC1 (top) and GPSC5 (bottom) are highlighted. The columns describe the serotypes and provincial region for each isolate. The branch length legends refer to single nucleotide polymorphisms (SNPs) per site and trees are midpoint rooted. b, Map of the nine provinces of South Africa coloured by province. Scale bar is included in kilometres (km). c, Count of isolates (n = 6,910) per collection year from 2000 to 2014 used in the lineage-level analysis (black) and the 9 dominant GPSCs used in the divergence time analysis (maroon). d, The mean geographical distance for sequence pairs as a function of cumulative evolutionary distance across all GPSCs with 95% CI (blue). The model fit is shown in red. The implied true pattern of spread is shown in purple, after accounting for a biased observation process. e, The proportion of NVT serotypes across the study period. f, The proportion of in silico predicted AMR isolates for four drugs across the study period. The vertical lines denote the introduction of PCV7 in 2009 and PCV13 in 2011. An interactive phylogeny and metadata are available at Microreact (https://microreact.org/project/7wqgd2gbBBEeBLLPKonbaT-belman2024southafricapneumococcus).
