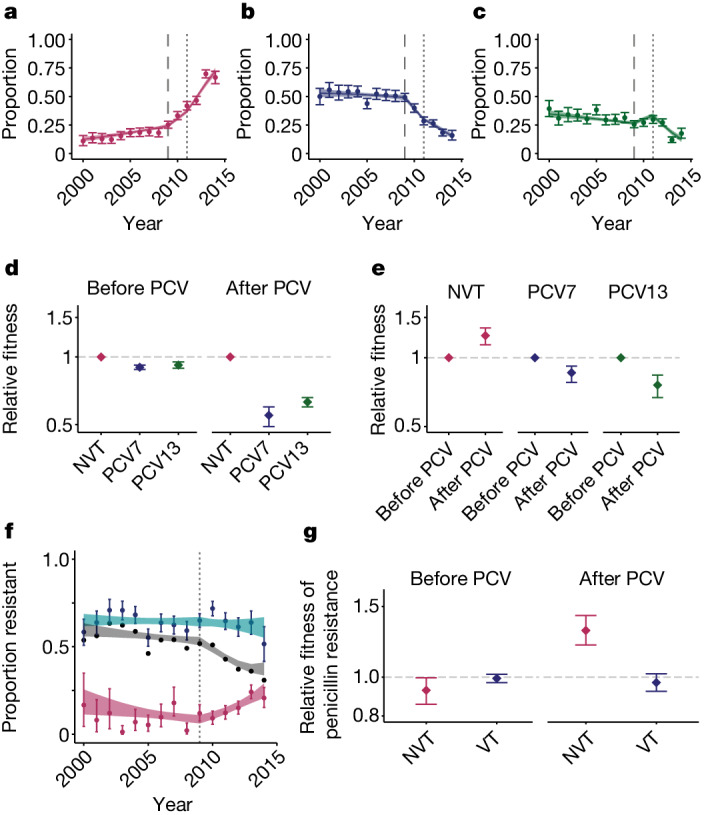
Fig. 4. Vaccine-induced fitness dynamics.

a–c, Data (points) and model fit (lines) for the proportion of serotypes from NVTs (a), PCV7 types (b) and additional PCV13 types not included in PCV7 (c) from the years 2000 to 2014 in this study. The long dashed line indicates the time of PCV7 implementation (2009) and the short, dashed line indicates the time of PCV13 implementation (2011). d, Relative fitness for the three groups of serotypes compared with the NVT fitness estimates before and after PCVs were introduced. e, Relative fitness estimates for all three groups of serotypes comparing the before and after PCV eras. For a–e, before PCV refers to before 2009 for NVT serotypes, before 2009 for PCV7 type serotypes and before 2011 for PCV13 type serotypes. f, Proportion of penicillin resistance overall (black line), within NVT strains (maroon points) and within VT strains (turquoise points) with model fits. The dashed line indicates the time of PCV implementation (2009). g, Relative fitness of penicillin resistance among NVTs (pink) and VTs (blue) in before (left) and after (right) PCVs. Data in d, e and g are on a log scale. For a–f, plots are centred at the median and include error bars representing 95% credible intervals around the posterior parameter distributions (n = 6,798).
