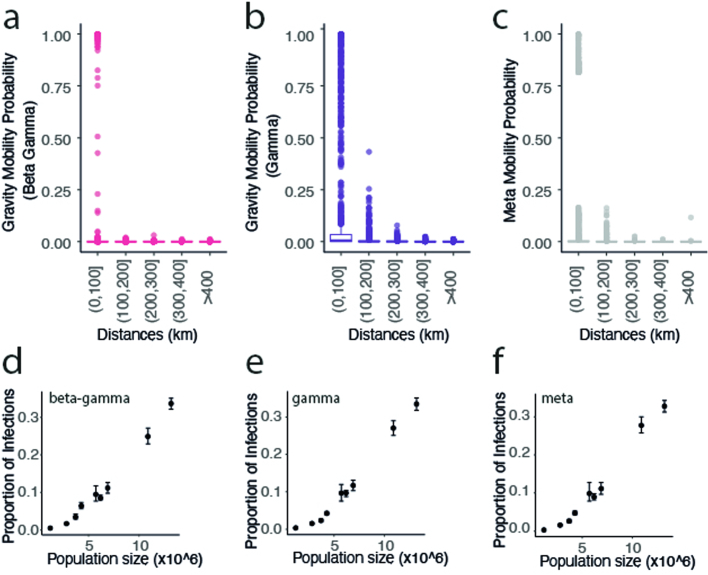
Extended Data Fig. 4. Estimated mobility and proportion of infections.
(a) a gravity model with two parameters adjusting the destination population size (beta) and the distance between locations (gamma) (pink), (b) a distance model whereby the probability of mobility is a function of the distance between locations adjusted with parameter gamma, (c) is the Meta mobility data between locations with a parameter adjusting the probability of staying in the home location (main model) across distances. (d-f) are the estimated proportion of infections by each of these models compared to the population size.

