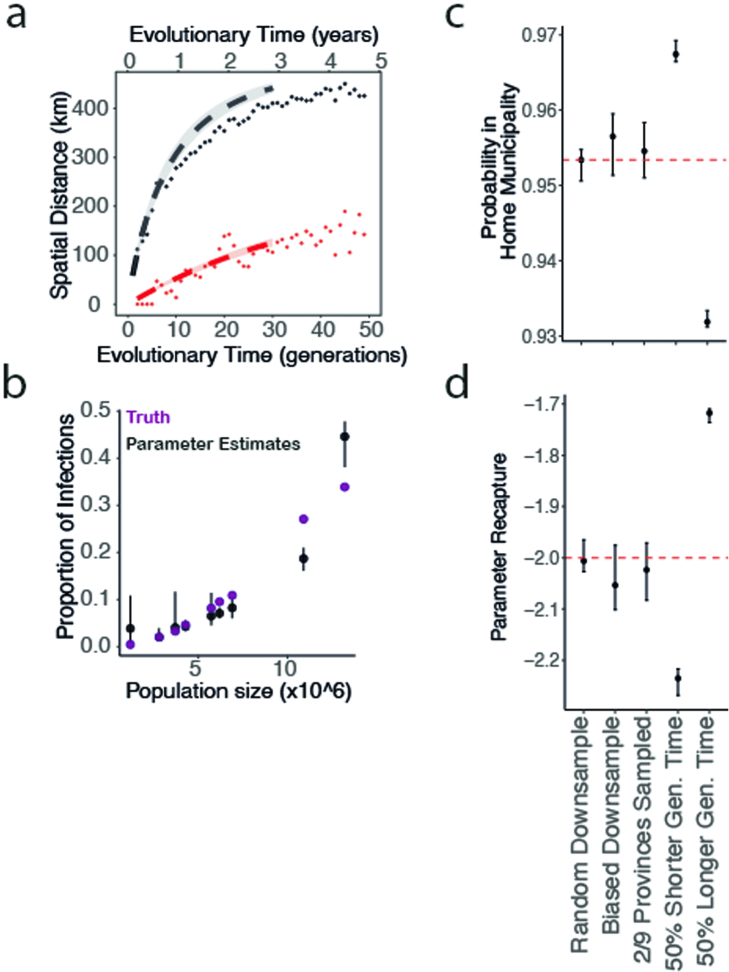
Extended Data Fig. 5. Replicated simulations for model performance testing.
Testing model performance using replicated simulations. (a) Simulated the total epidemic (black dots), biased down-sampled data as per true proportion per province (red dots) (“Biased Down-sample” in c and d), model fit to down-sampled data (red line), removing the sampling probability the model recapturing the true epidemic (black dot) (b) Population size (x-axis) compared to the proportion of infections from the down-sampled data (black) compared to the truth from the overall simulated epidemic (purple). (c) The probability of being in the home municipality and (d) the recaptured parameter after inputting a parameter of −2 to adjust the diagonal of the mobility matrix after one transmission generation. Both c and d include values from left to right for sampling as per the true data proportions in each province (6.5% of total infections), down-sampling to fit on only 2 of the 9 provinces, and if our generation time estimate is 50% smaller than the truth, exactly right, or 50% larger. Error bars represent 2.5 to 97.5 percentiles.

