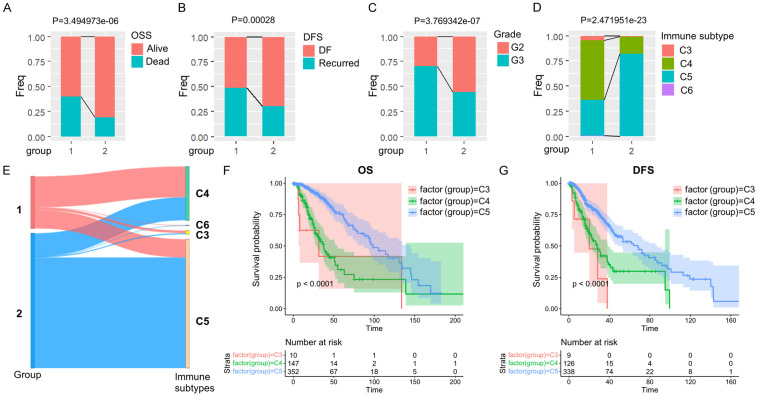
Figure 3.
Comparison of clinical and molecular immune features in LGG subtypes. A-D. Comparison of the distribution of two subtypes in various clinical features and molecular immune subtypes in the TCGA dataset. E. Comparison of existing molecular immune subtypes with two subtypes. F, G. KM OS time and DFS time curves among existing immune molecule subtypes.

