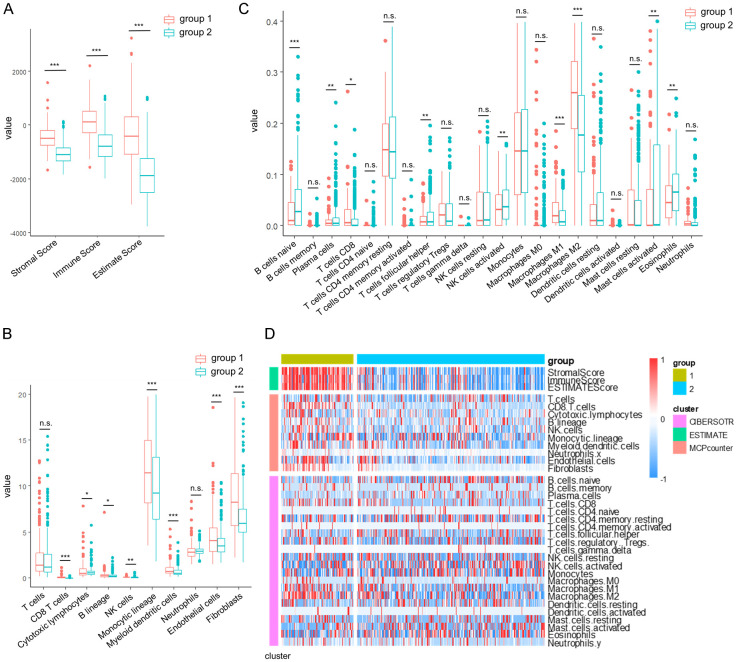
Figure 4.
Comparison of immune scores in LGG molecular subtypes. (A-C) Comparison of Estimated immunity scores (A), MCPcounter immune scores (B), and CIBERSOTR immunity scores (C) between molecular subtypes in the TCGA dataset. (D) Heat map comparing immune scores between molecular subtypes in the TCGA data set by three immune software. The data in (A-C) are shown as the mean ± SEM. *P < 0.05; **P, 0.01; ***P, 0.001 (two-way ANOVA followed by Tukey’s multiple comparisons for A-C).

